Text2SQL Talk to Database in Natural Language and Get Automated Visualization: PostgreSQL Example:Powered by Vanna AI+Ollama. Other Important Tools/Database/LLM in this Article are ChromaDB/Jupyter Notebook/Mistral LLM.
Vanna AI
https://github.com/vanna-ai/vanna
Chat with your SQL database. Accurate Text-to-SQL Generation via LLMs using RAG
Let Vanna AI write your SQL for you
The fastest way to get actionable insights from your database just by asking questions
Why Vanna
Open-Source
The Vanna Python package and the various frontend integrations are all open-source. You can run Vanna on your own infrastructure.
High accuracy on complex datasets
Vanna’s capabilities are tied to the training data you give it. More training data means better accuracy for large and complex datasets.
Designed for security
Your database contents are never sent to the LLM unless you specifically enable features that require it. The metadata storage layer only sees schemas, documentation, and queries.
Self learning
As you use Vanna more, your model continuously improves as we augment your training data.
Supports many databases
Snowflake , BigQuery, Postgres, and many others. You can easily make a connector for any database.
Choose your front end
Start in a Jupyter Notebook. Expose to business users via Slackbot, web app, Streamlit app, any other frontend. Even integrate in your web app for customers.
Ollama: Large Language Model Runner.
https://github.com/ollama/ollama
https://hub.docker.com/r/ollama/ollama
https://github.com/ollama/ollama-python
https://github.com/ollama/ollama-js
ChromaDB:
https://github.com/chroma-core/chroma
the AI-native open-source embedding database
Simple: Fully-typed, fully-tested, fully-documented == happiness
Integrations: LangChain (python and js), LlamaIndex and more soon
Dev, Test, Prod: the same API that runs in your python notebook, scales to your cluster
Feature-rich: Queries, filtering, density estimation and more
Free & Open Source: Apache 2.0 Licensed
Use case: Chat
For example, the “Chat your data” use case:
- Add documents to your database. You can pass in your own embeddings, embedding function, or let Chroma embed them for you.
- Query relevant documents with natural language.
- Compose documents into the context window of an LLM like GPT3 for additional summarisation or analysis.
PostgreSQL is a powerful, open source object-relational database system that uses and extends the SQL language combined with many features that safely store and scale the most complicated data workloads. The origins of PostgreSQL date back to 1986 as part of the POSTGRES project at the University of California at Berkeley and has more than 35 years of active development on the core platform.
PostgreSQL has earned a strong reputation for its proven architecture, reliability, data integrity, robust feature set, extensibility, and the dedication of the open source community behind the software to consistently deliver performant and innovative solutions. PostgreSQL runs on all major operating systems, has been ACID-compliant since 2001, and has powerful add-ons such as the popular PostGIS geospatial database extender. It is no surprise that PostgreSQL has become the open source relational database of choice for many people and organisations.
Getting started with using PostgreSQL has never been easier — pick a project you want to build, and let PostgreSQL safely and robustly store your data.
JupyterLab is the latest web-based interactive development environment for notebooks, code, and data. Its flexible interface allows users to configure and arrange workflows in data science, scientific computing, computational journalism, and machine learning. A modular design invites extensions to expand and enrich functionality.
Plotly’s Python graphing library makes interactive, publication-quality graphs. Examples of how to make line plots, scatter plots, area charts, bar charts, error bars, box plots, histograms, heatmaps, subplots, multiple-axes, polar charts, and bubble charts. Plotly.py is free and open source and you can view the source, report issues or contribute on GitHub
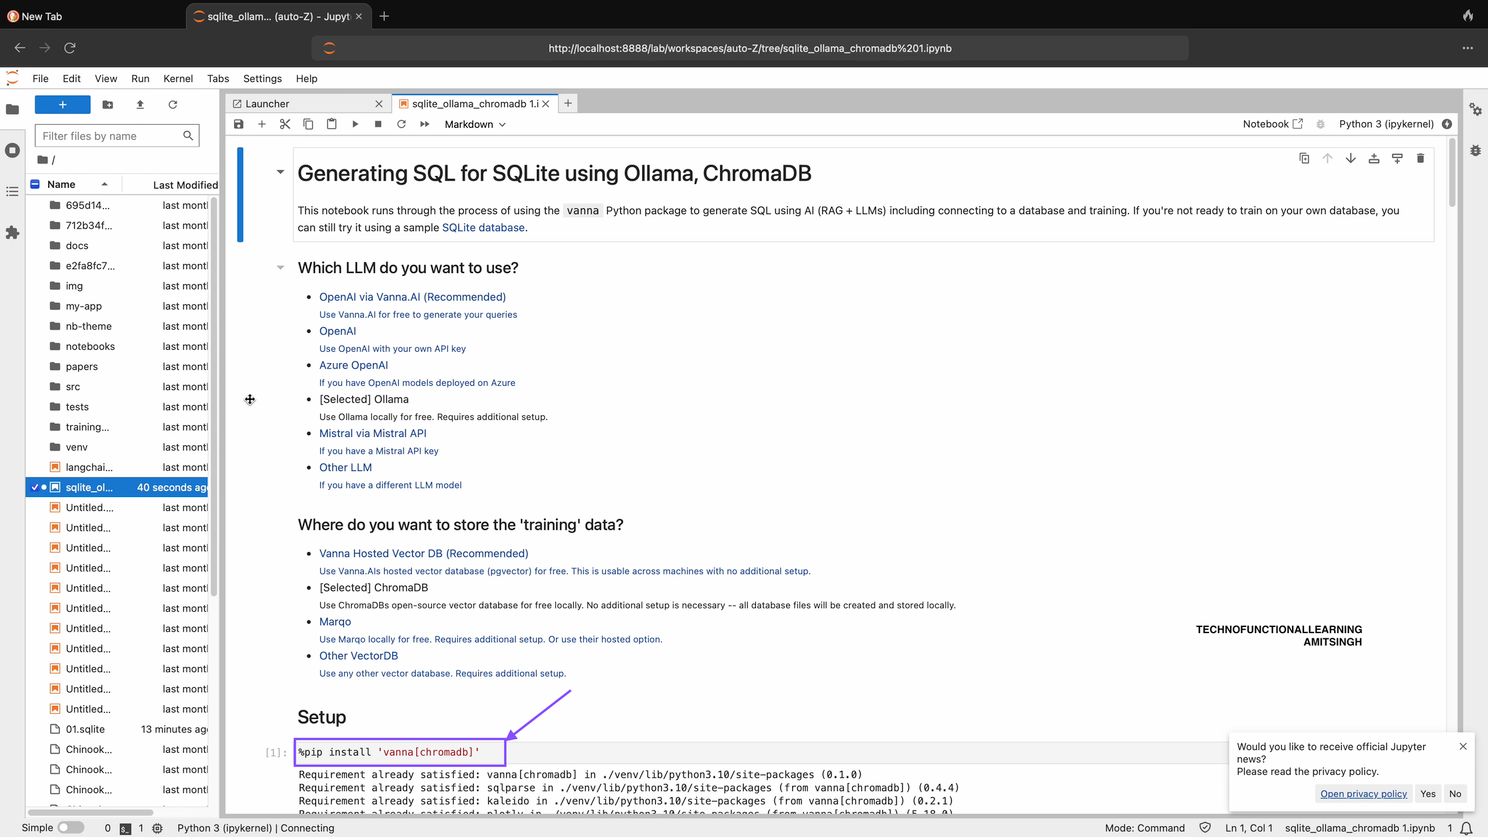
Now here is How to get started.
Step 01: Open Jupyter Notebook and type below command
pip install 'vanna[chromadb,postgres]'
Step 02: Now after running first command type below command in Jupyter Notebook.
from vanna.ollama import Ollama
from vanna.chromadb.chromadb_vector import ChromaDB_VectorStore

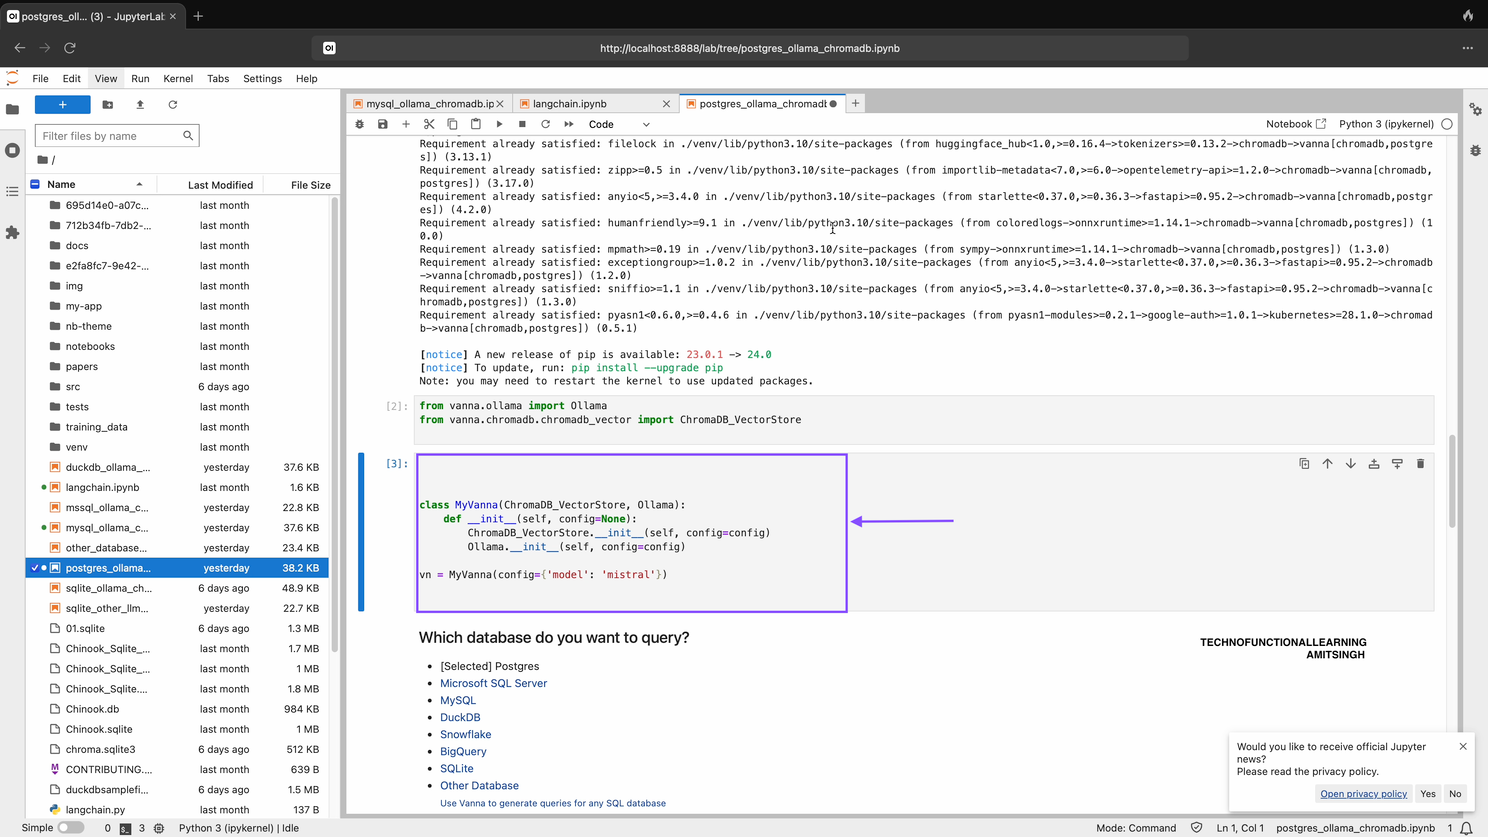
Step 03: Now Connect Vanna/Chromadb/Ollama-Mistral Model by typing and running below command in Jupyter Notebook.
class MyVanna(ChromaDB_VectorStore, Ollama):
    def __init__(self, config=None):
        ChromaDB_VectorStore.__init__(self, config=config)
        Ollama.__init__(self, config=config)
vn = MyVanna(config={'model': 'mistral'})
if by any chance you get error that mistra model not found then type below command to pull mistral model
ollama.pull('mistral')
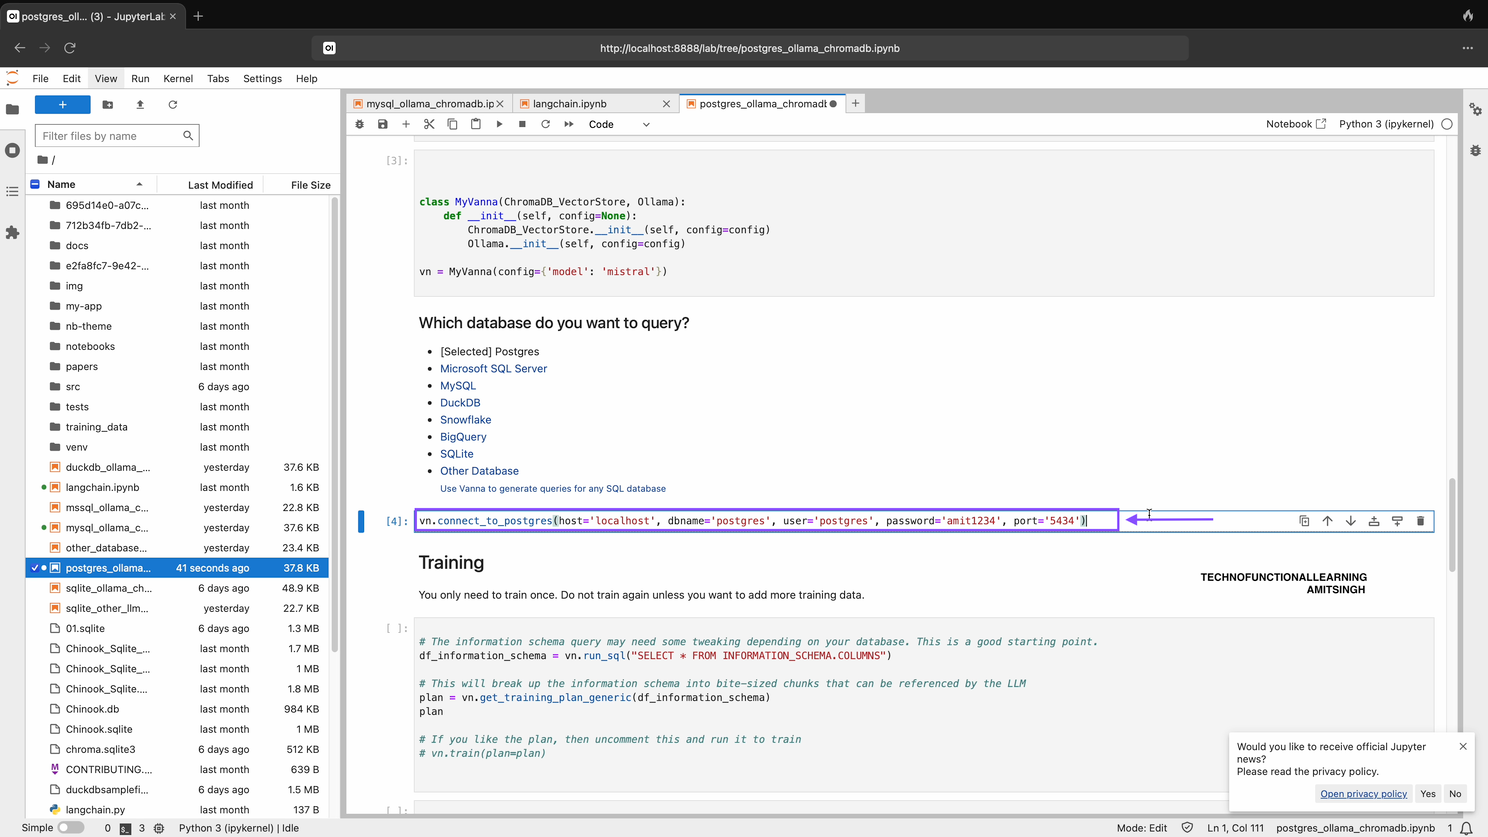
Step 04: Now Connect with PostgreSQL DB with below command, Host will be localhost or cloudhost, db name should be your PostgreSQL Database name, user name and password for your database, default port is 5432, you can check and enter the port for PostgreSQL Instance.
vn.connect_to_postgres(host='my-host', dbname='my-dbname', user='my-user', password='my-password', port='my-port')
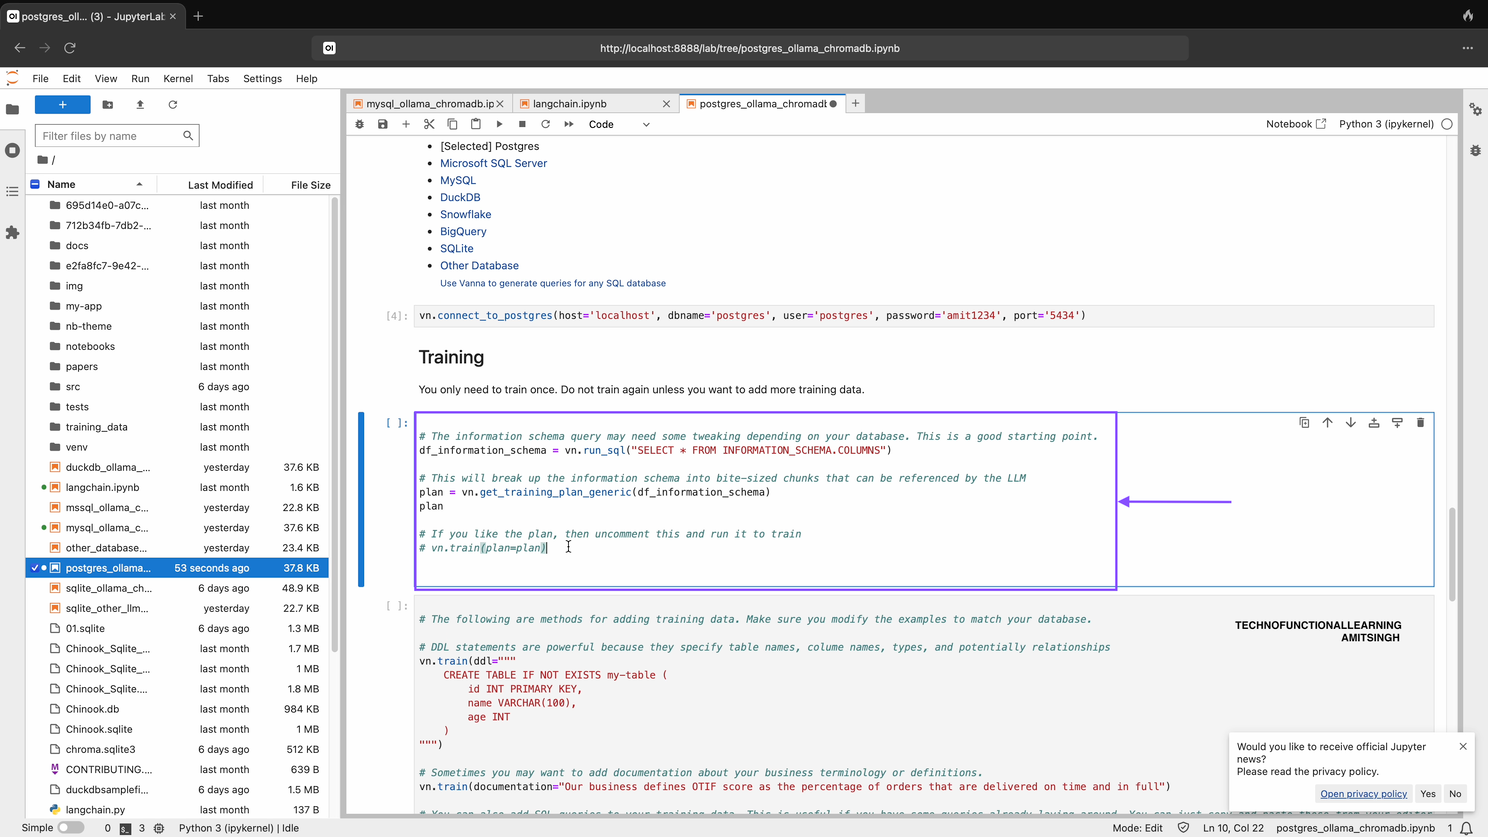
Step 05: You can training you data once unless you have added other data with below command.
# The information schema query may need some tweaking depending on your database. This is a good starting point.
df_information_schema = vn.run_sql("SELECT * FROM INFORMATION_SCHEMA.COLUMNS")
# This will break up the information schema into bite-sized chunks that can be referenced by the LLM
plan = vn.get_training_plan_generic(df_information_schema)
plan
# If you like the plan, then uncomment this and run it to train
# vn.train(plan=plan)
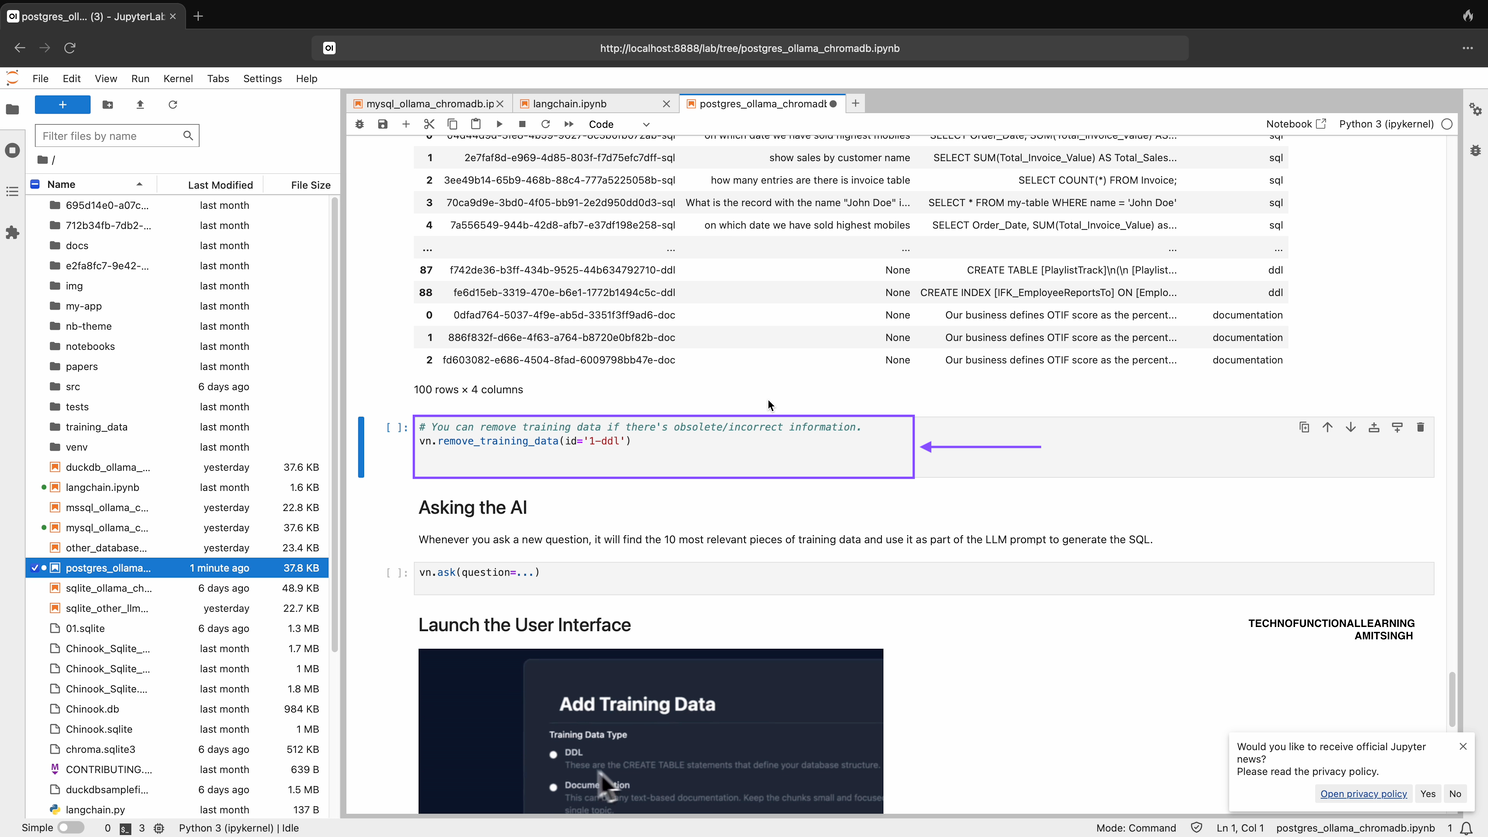
Step 06: At any time you can inspect what training data the package is able to reference
training_data = vn.get_training_data()
training_data

Step 07: You can remove training data if there’s obsolete/incorrect information.
vn.remove_training_data(id='1-ddl')
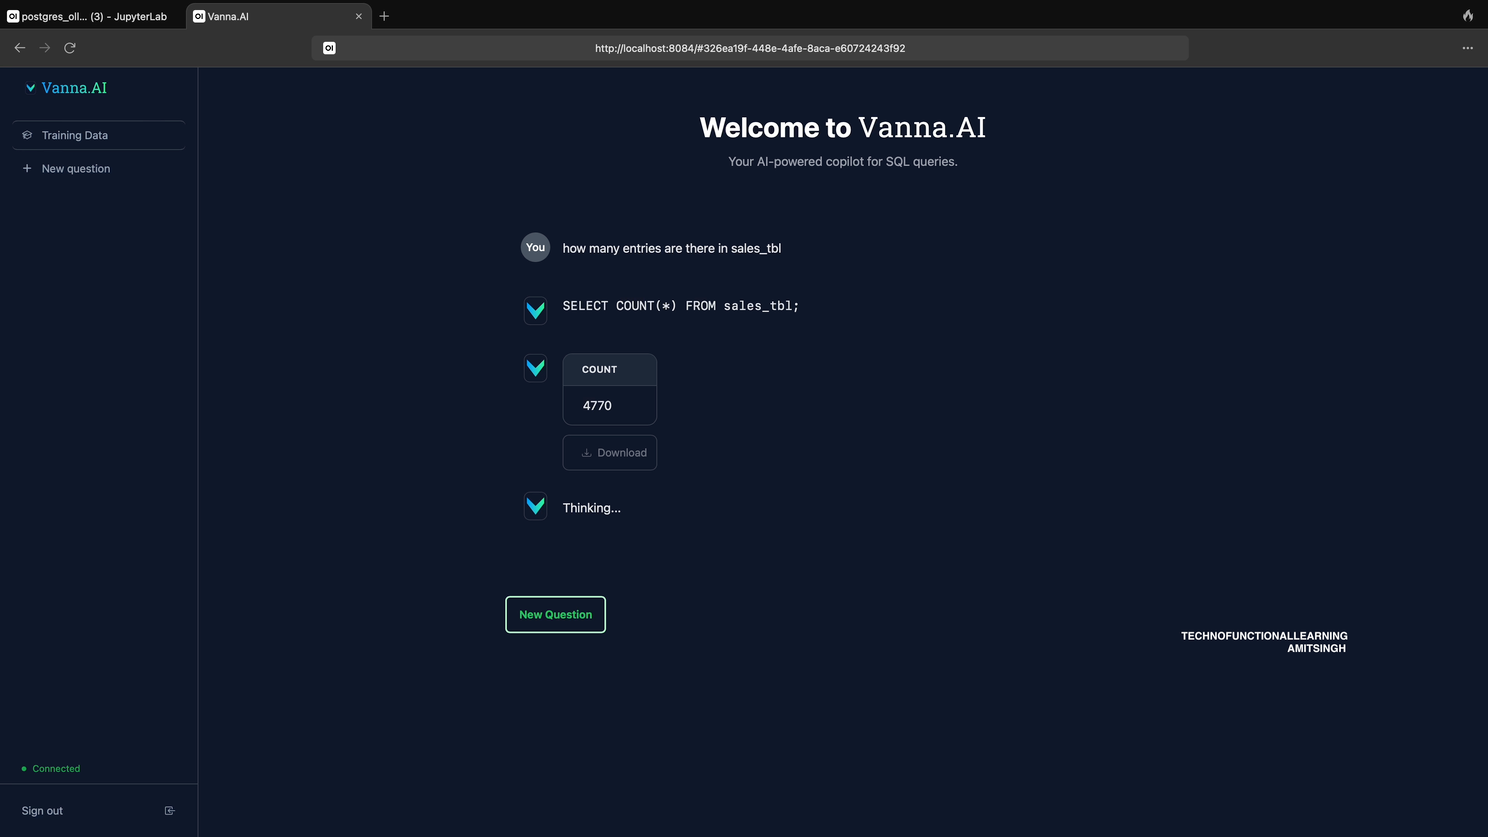
Step 08: Now You can start flask app by typing and running below command in Jupyter Notebook, App will be available at localhost:8084 and start Asking your question in Natural Language.
from vanna.flask import VannaFlaskApp
app = VannaFlaskApp(vn)
app.run()

Step 09: Now Start asking question in Natural Language First it will show results and then generate automated Visualization based on Plotly like show below.

Results
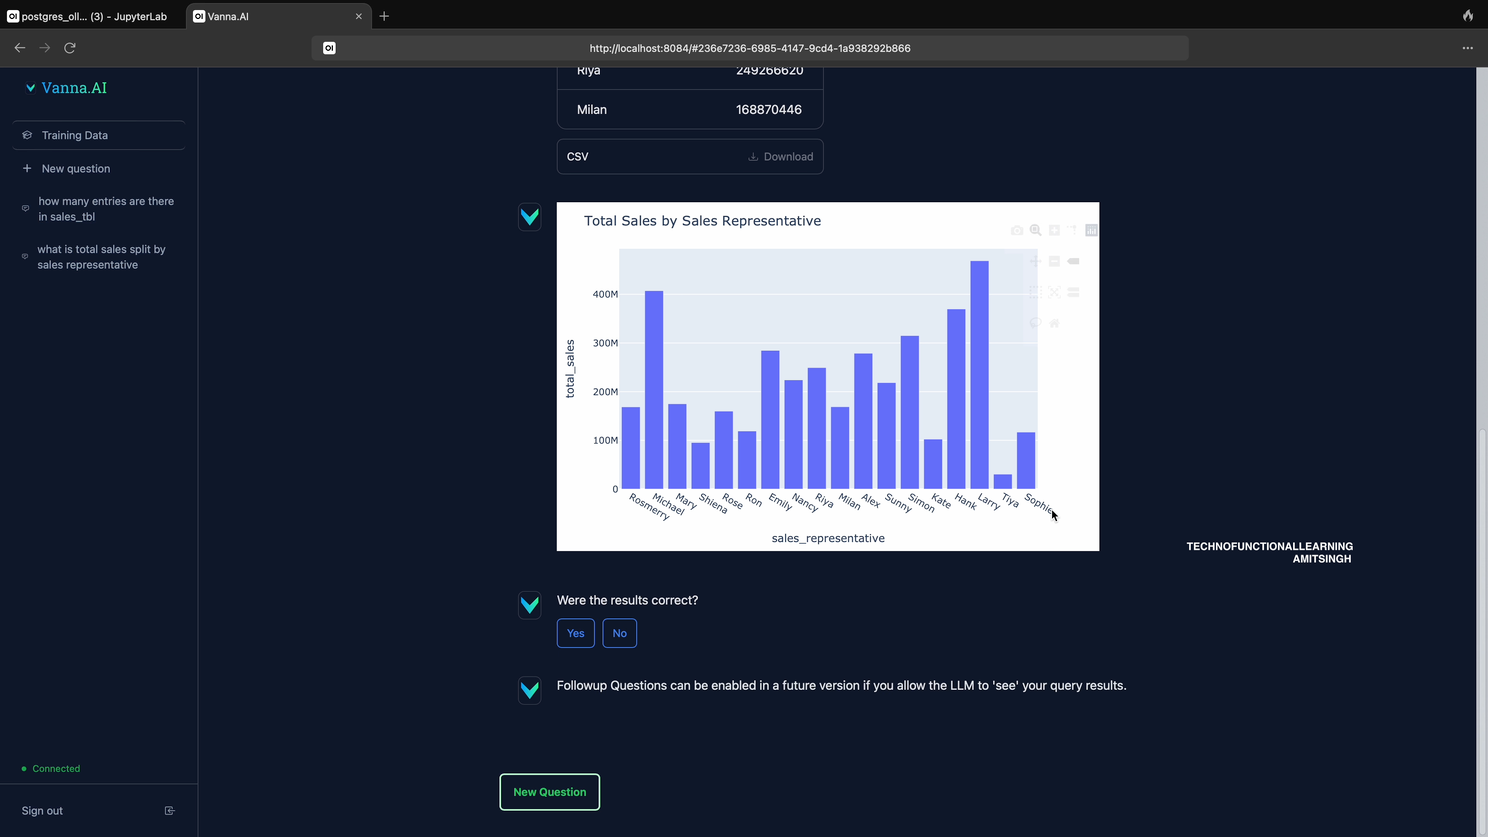
Then Automated Visualization

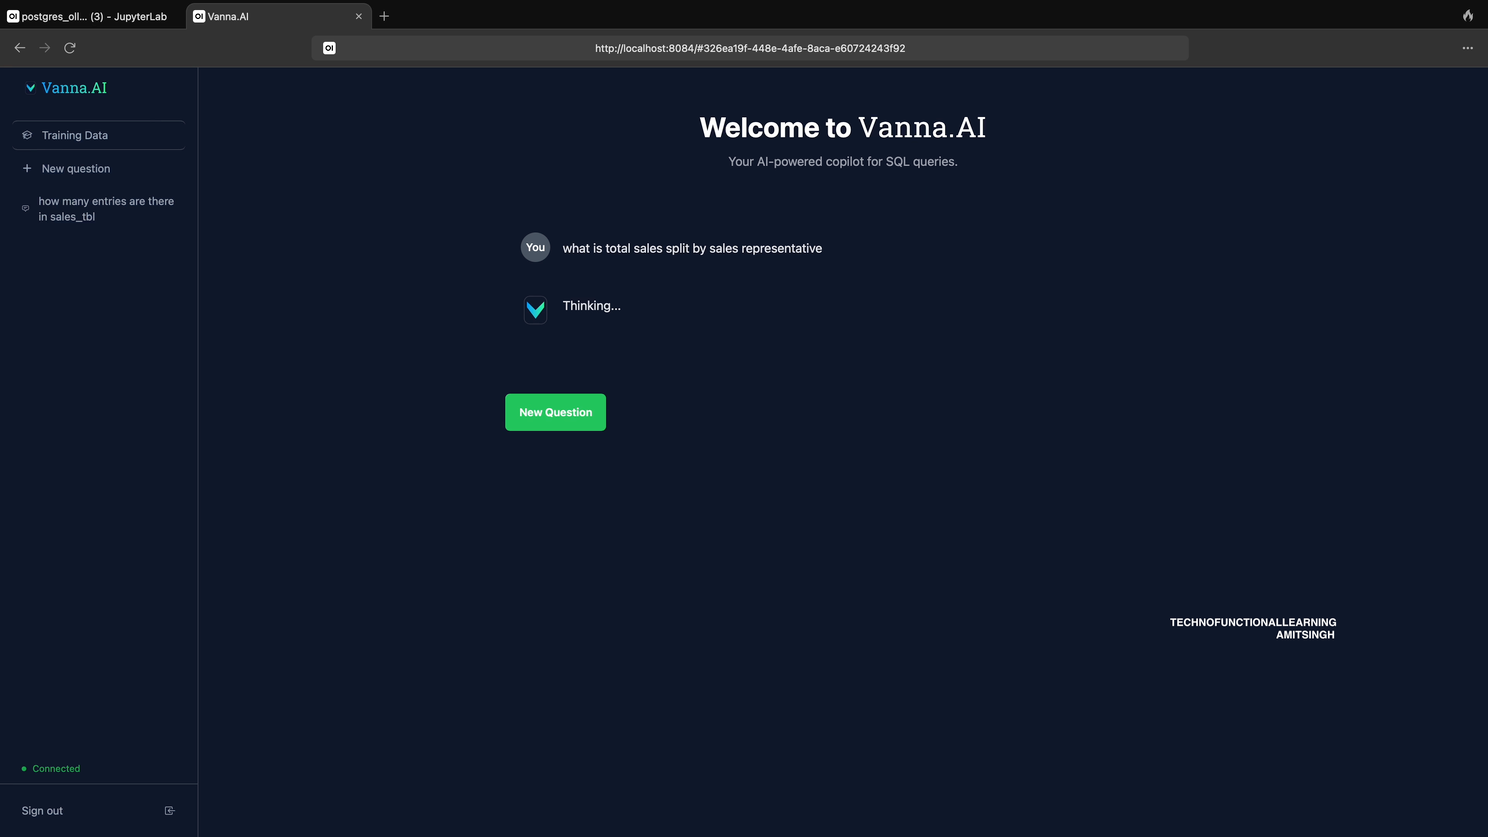
Step 10: You can ask other question
Q2
Answer

Visualization
Here is 4 Minute Youtube Video for visual reference.
