Learn to Create Visualization with Open Source Data Visualization software Metabase, Run Visual Query, Create DashBoard and Automated Insights.
What is Metabase?
The simplest, fastest way to get business intelligence and analytics to everyone in your company
Fast analytics with the friendly UX and integrated tooling to let your company explore data on their own
Where is github repository?
https://github.com/metabase/metabase
Where is Website?
How to Install Metabase?
Here is Quick visual recording of Metabase Installation.
How to Connect with Various Databases?
Here is list of few databases which you can connect on your laptop or desktop (More data connection coming soon).
Now Here is how to get started with Visual SQL Queries, Create Visualization, Create dashboard, Automated Insight.
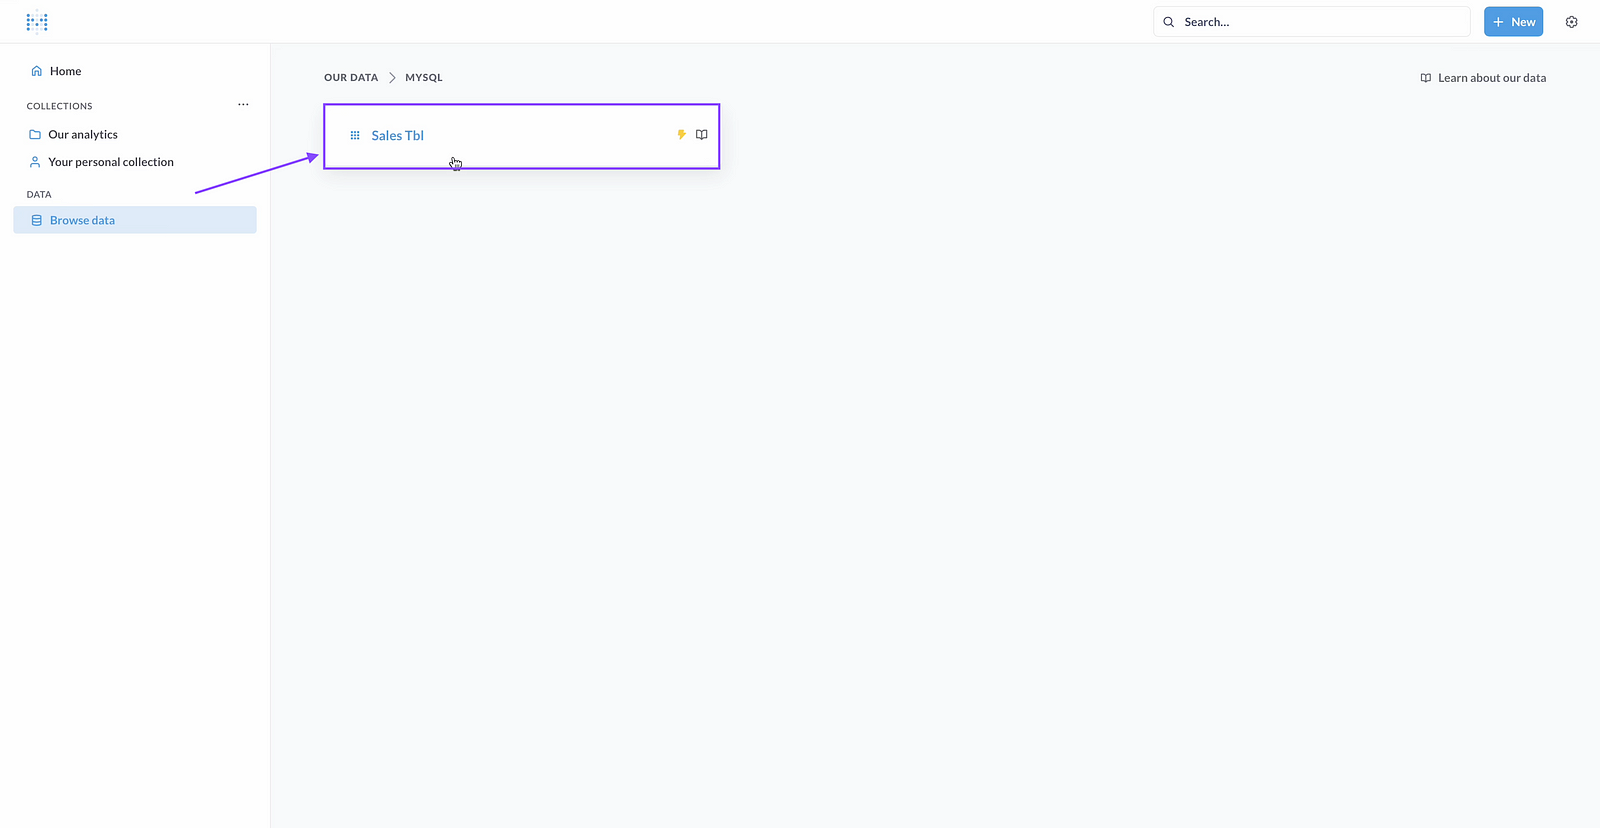
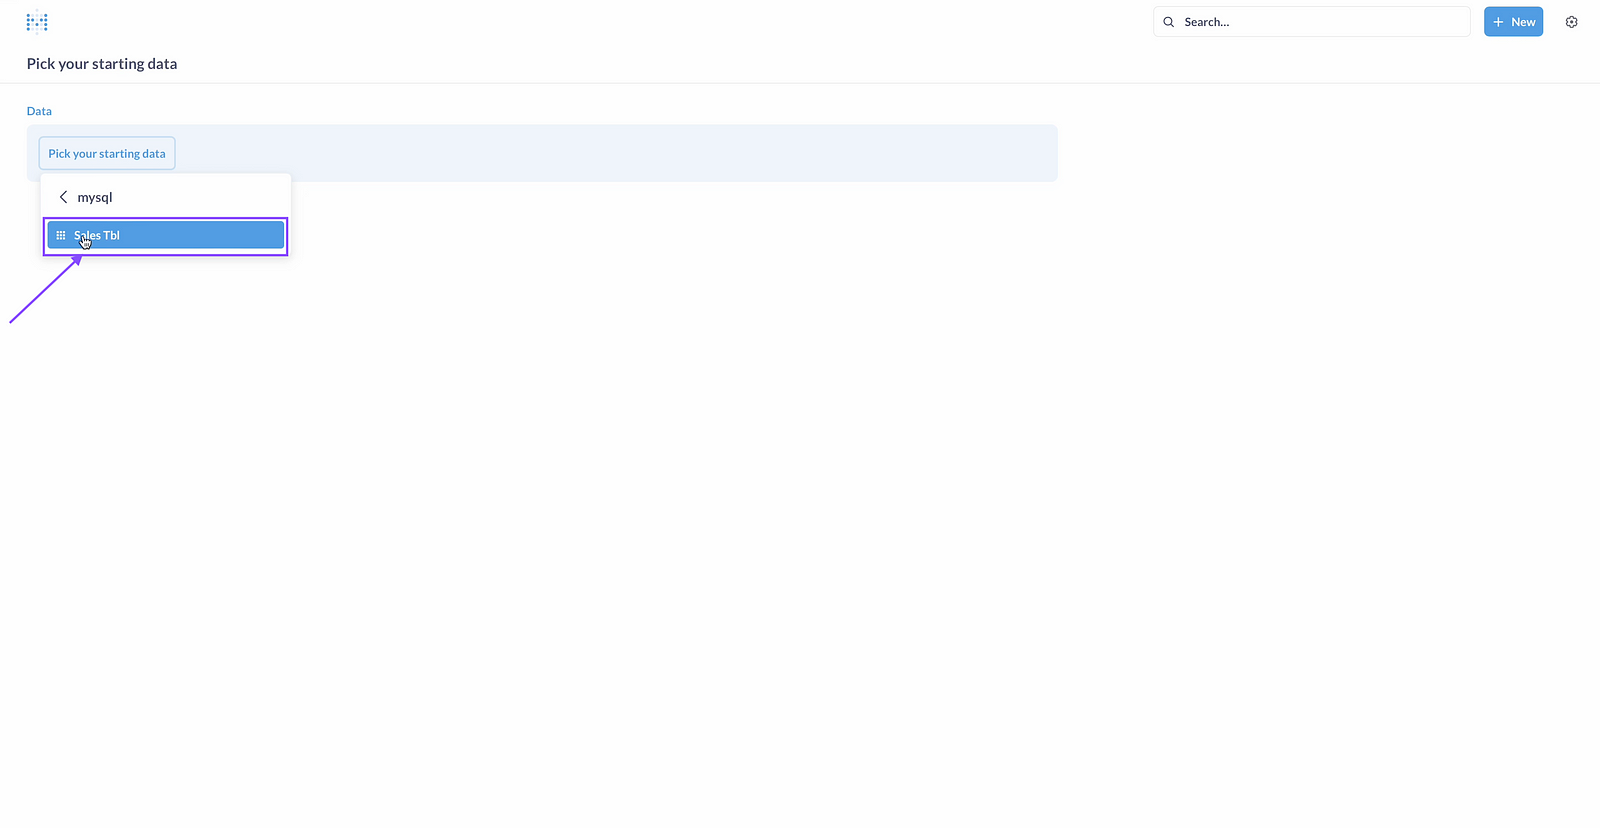
Step 01: Choose Your Database

Step 02: choose database table
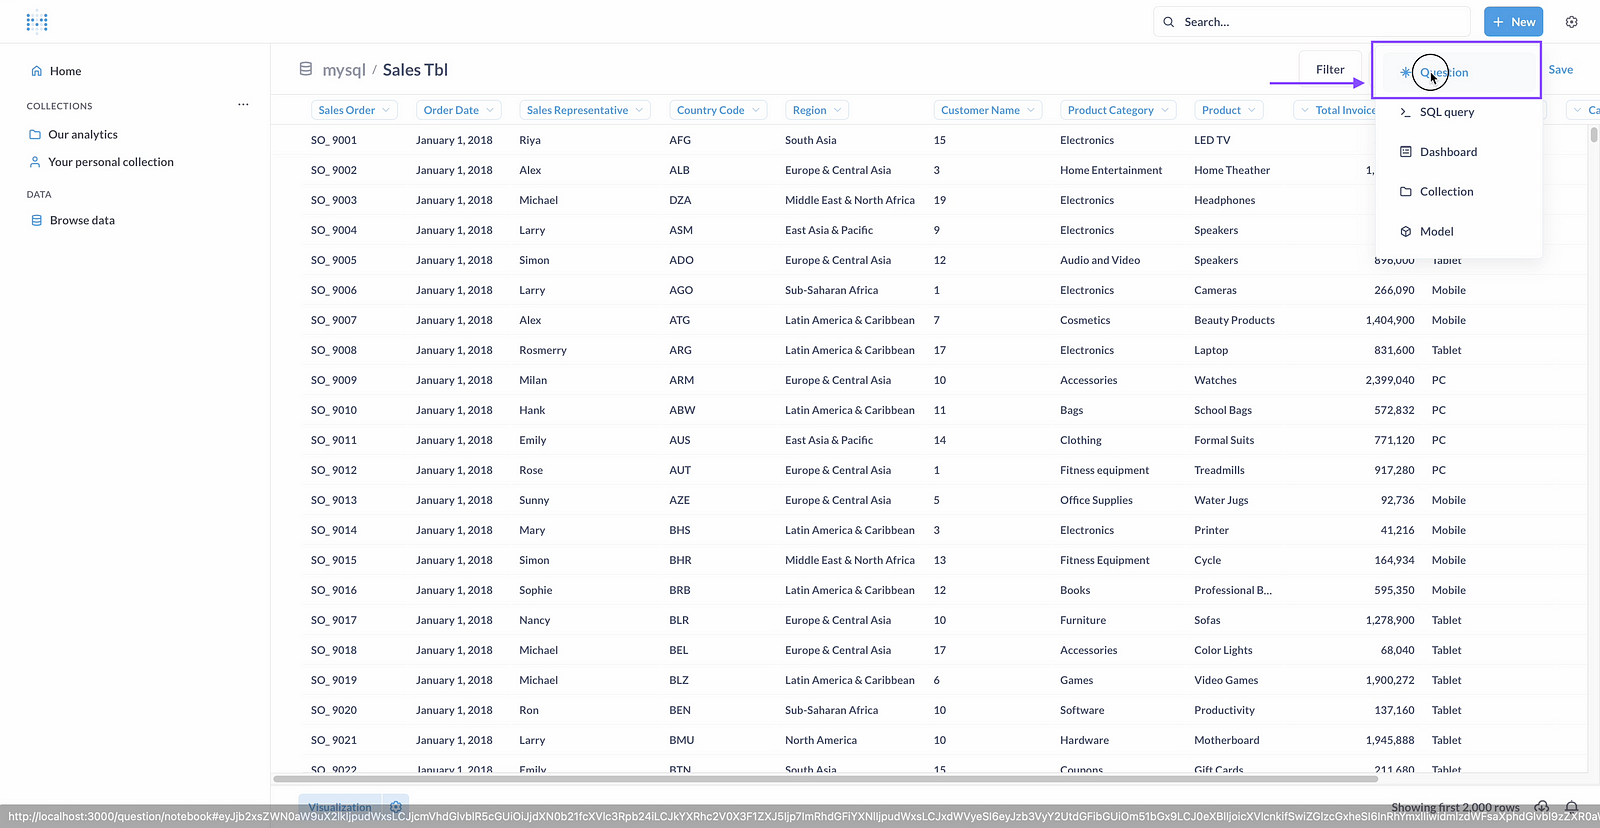
Step 03: qlick on New Question
Step 04: Click on Database Table
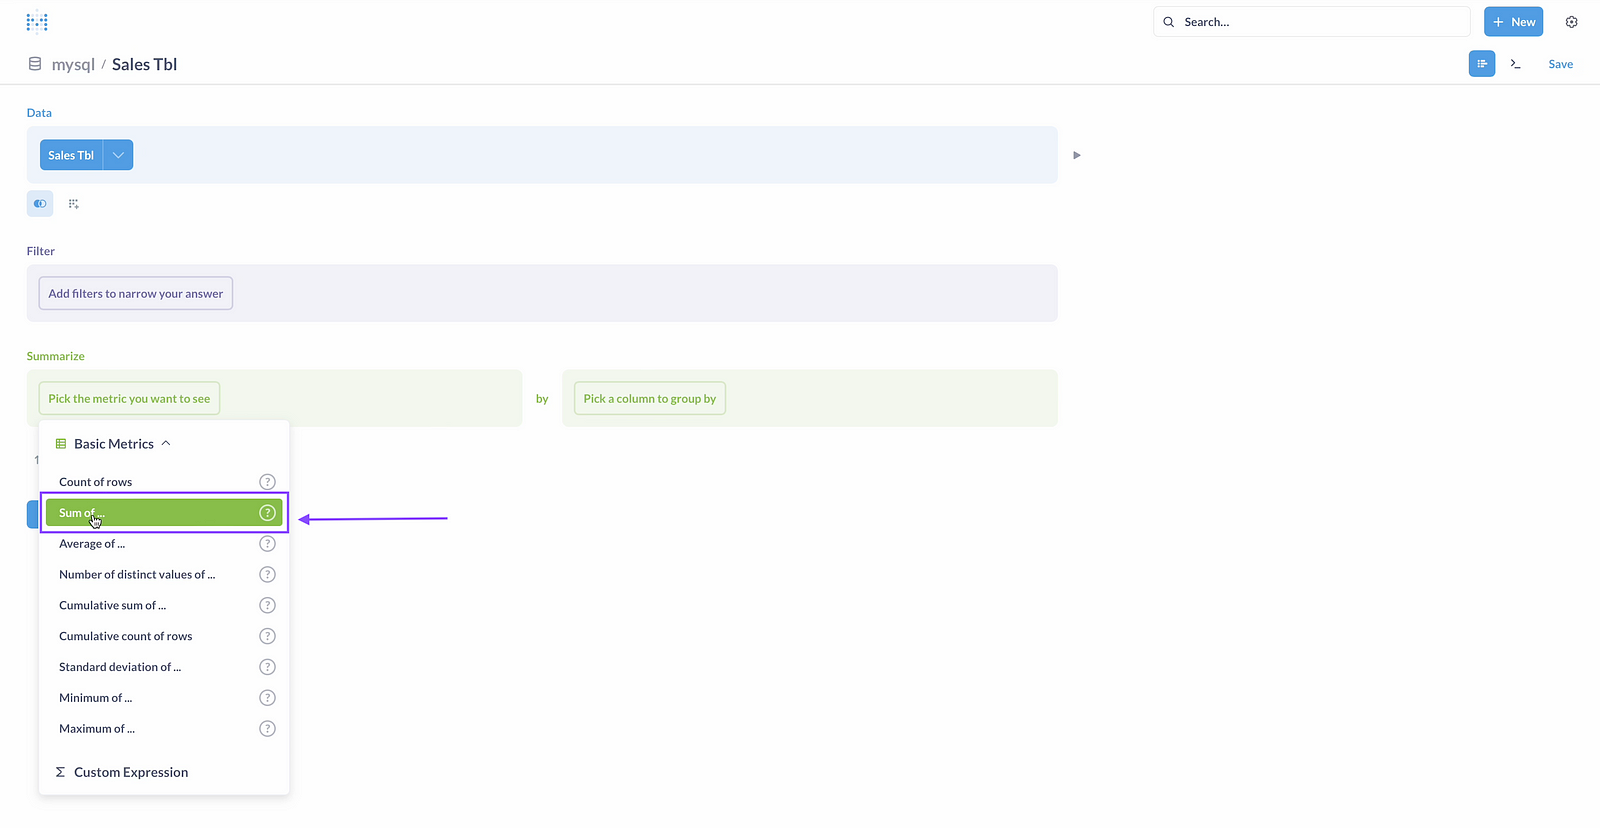
Step 05: Choose Basic Metrics
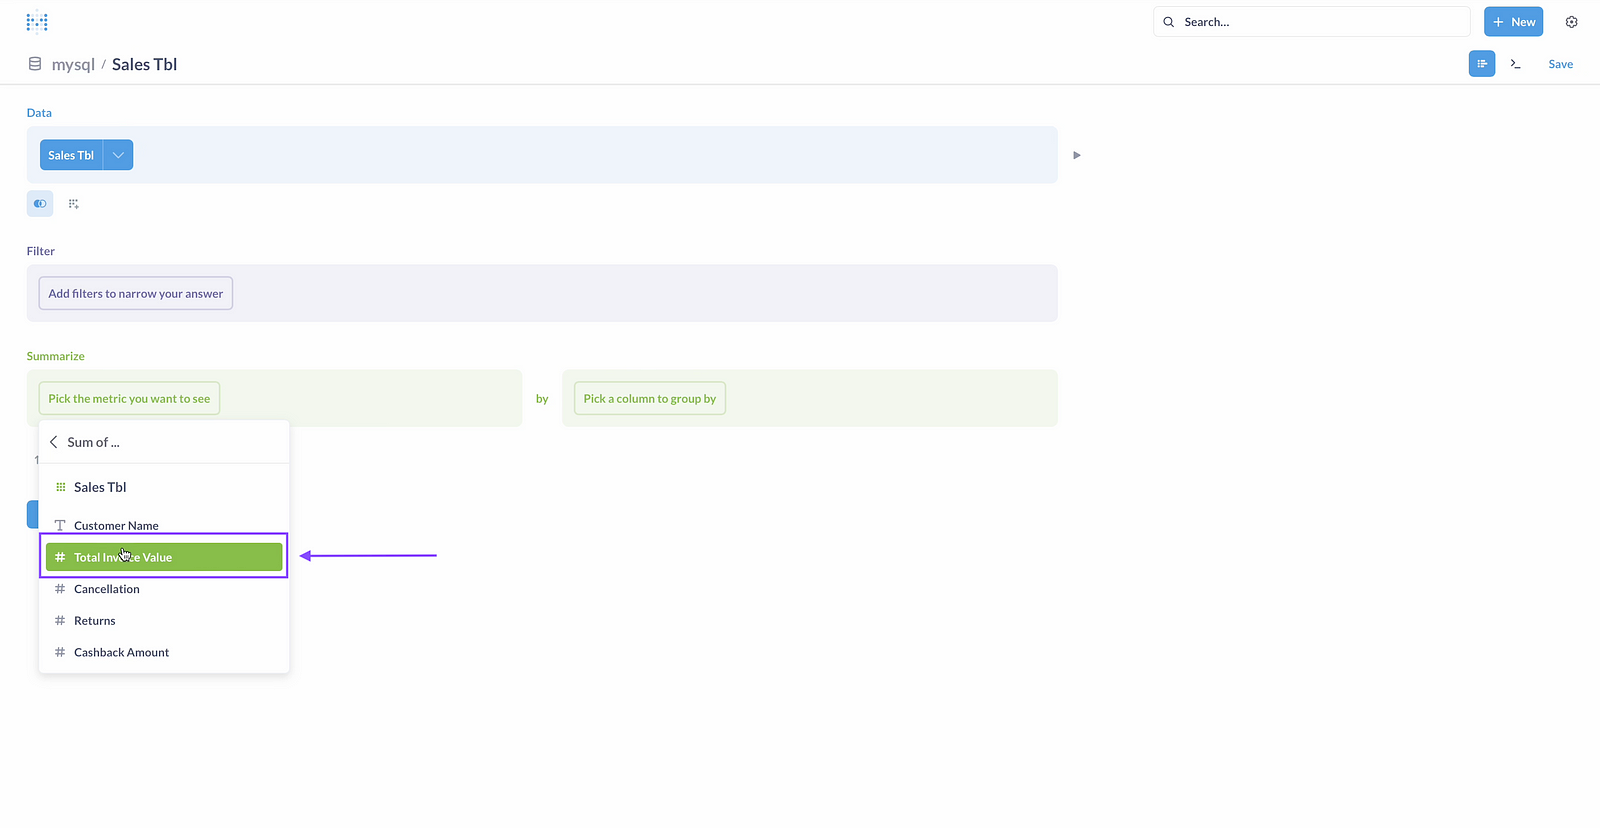
Step 06: Choose your metrics
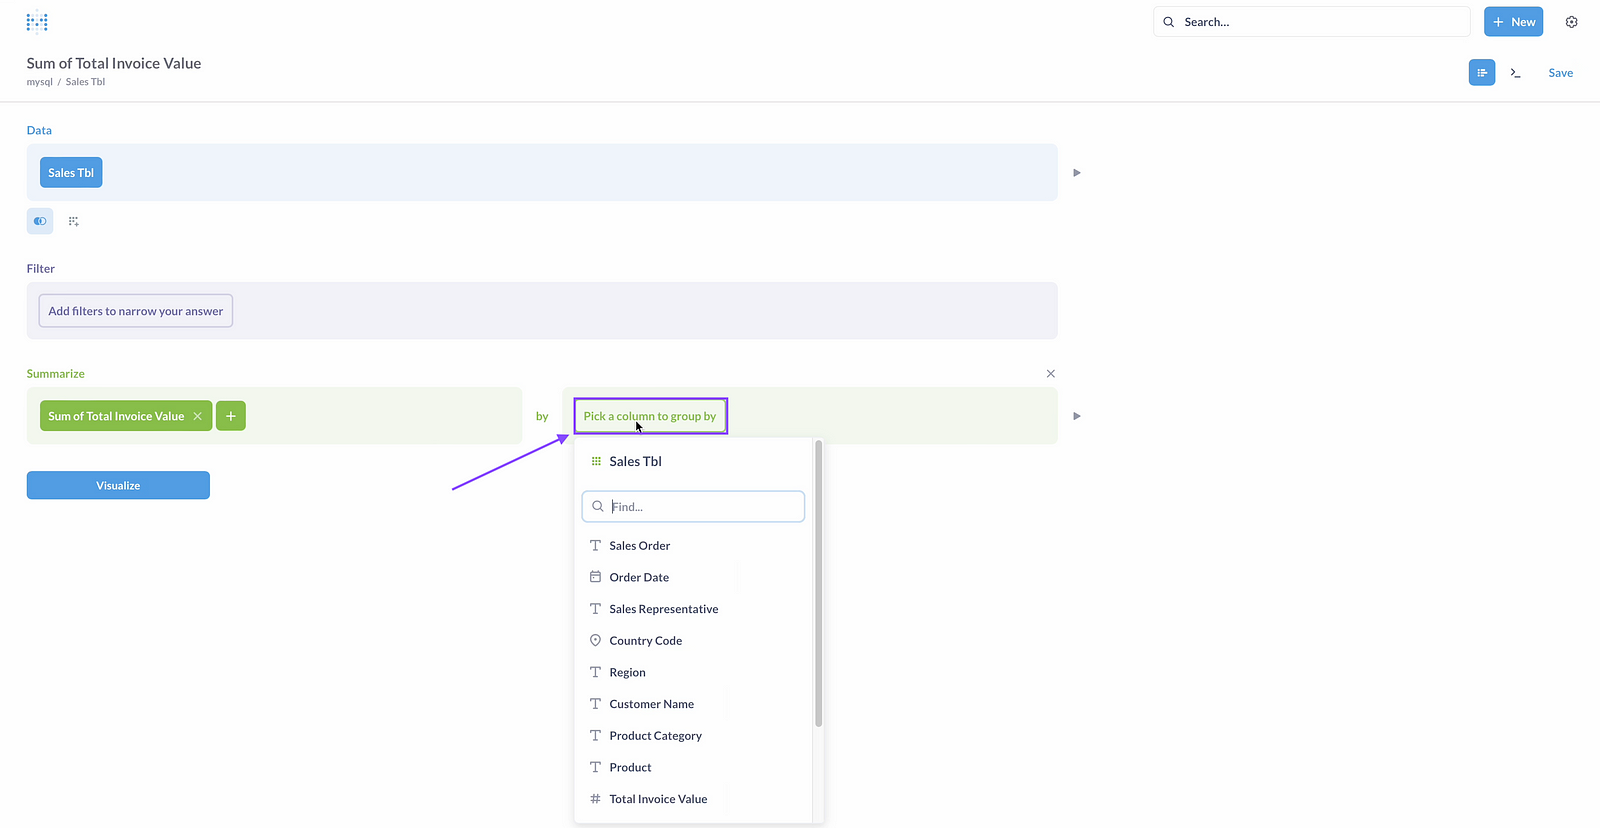
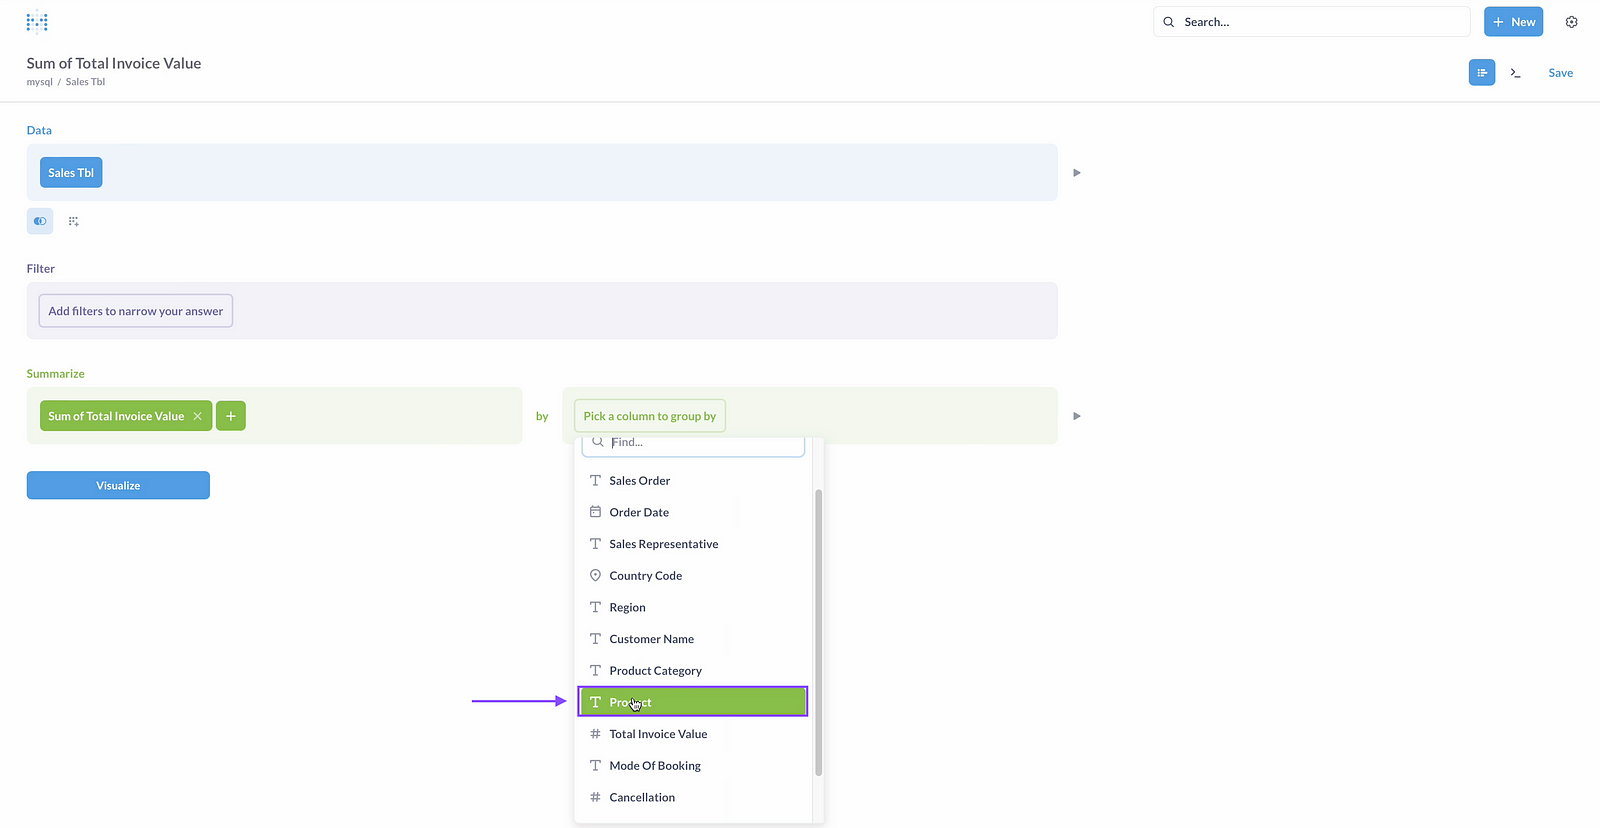
Step 07: Pickup column to group by.
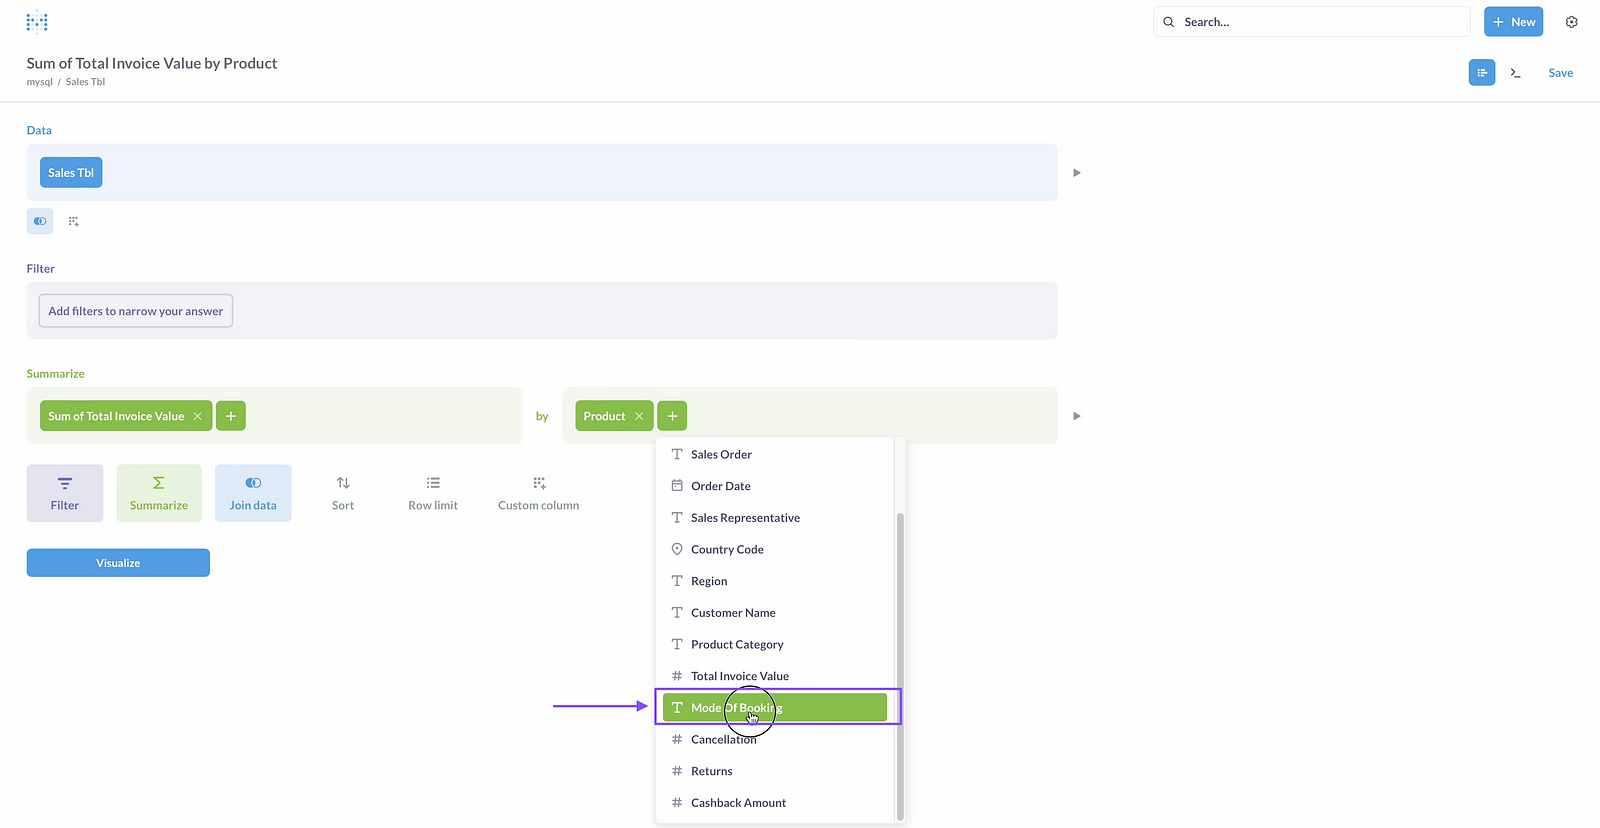
Step 08:Choose Another column if you want to make it stacked bar.
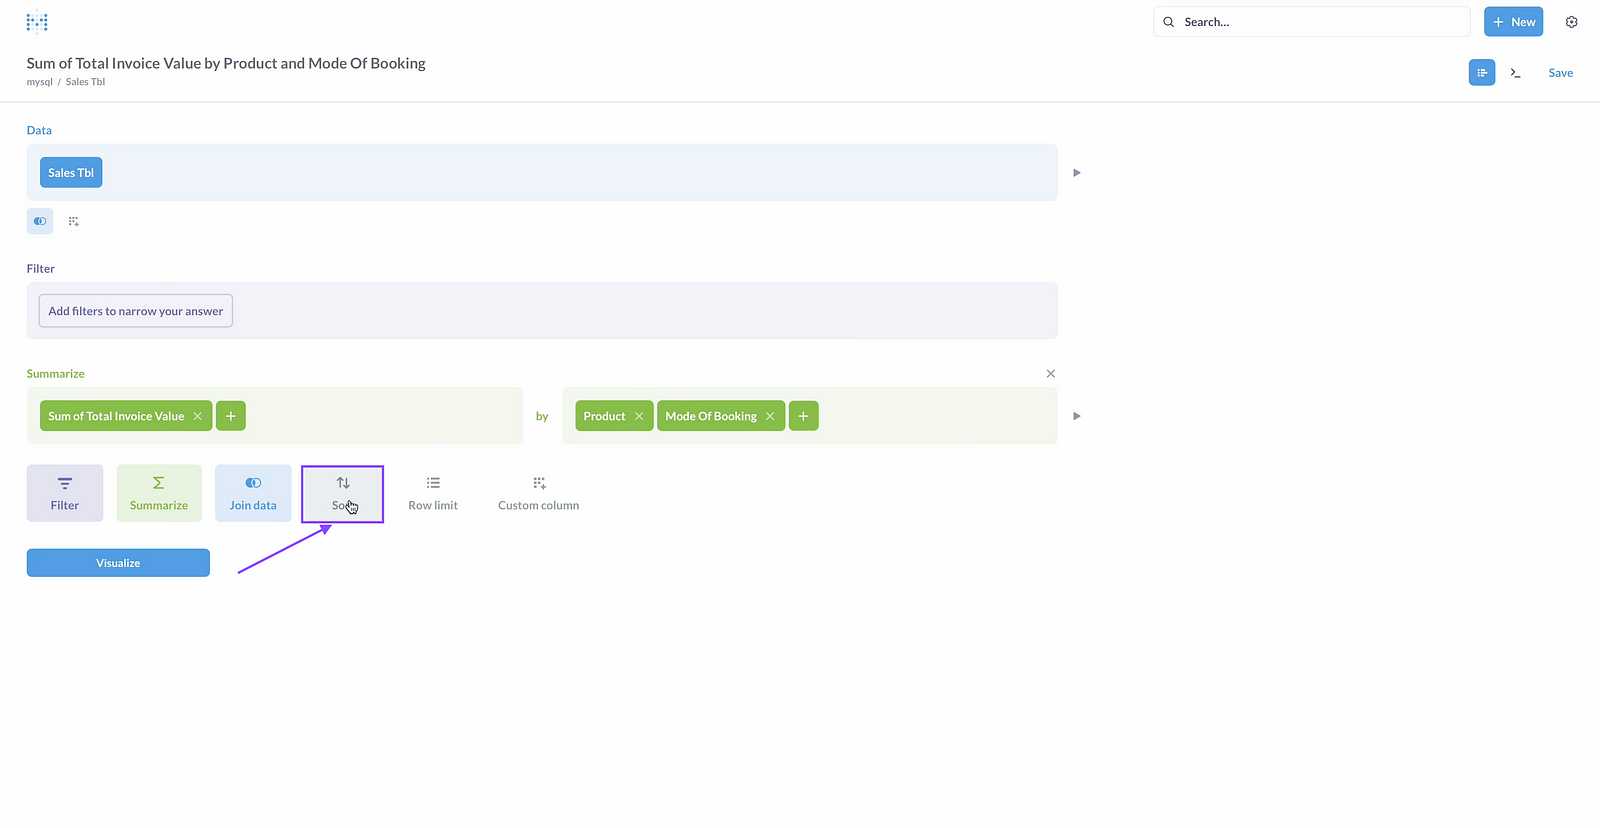
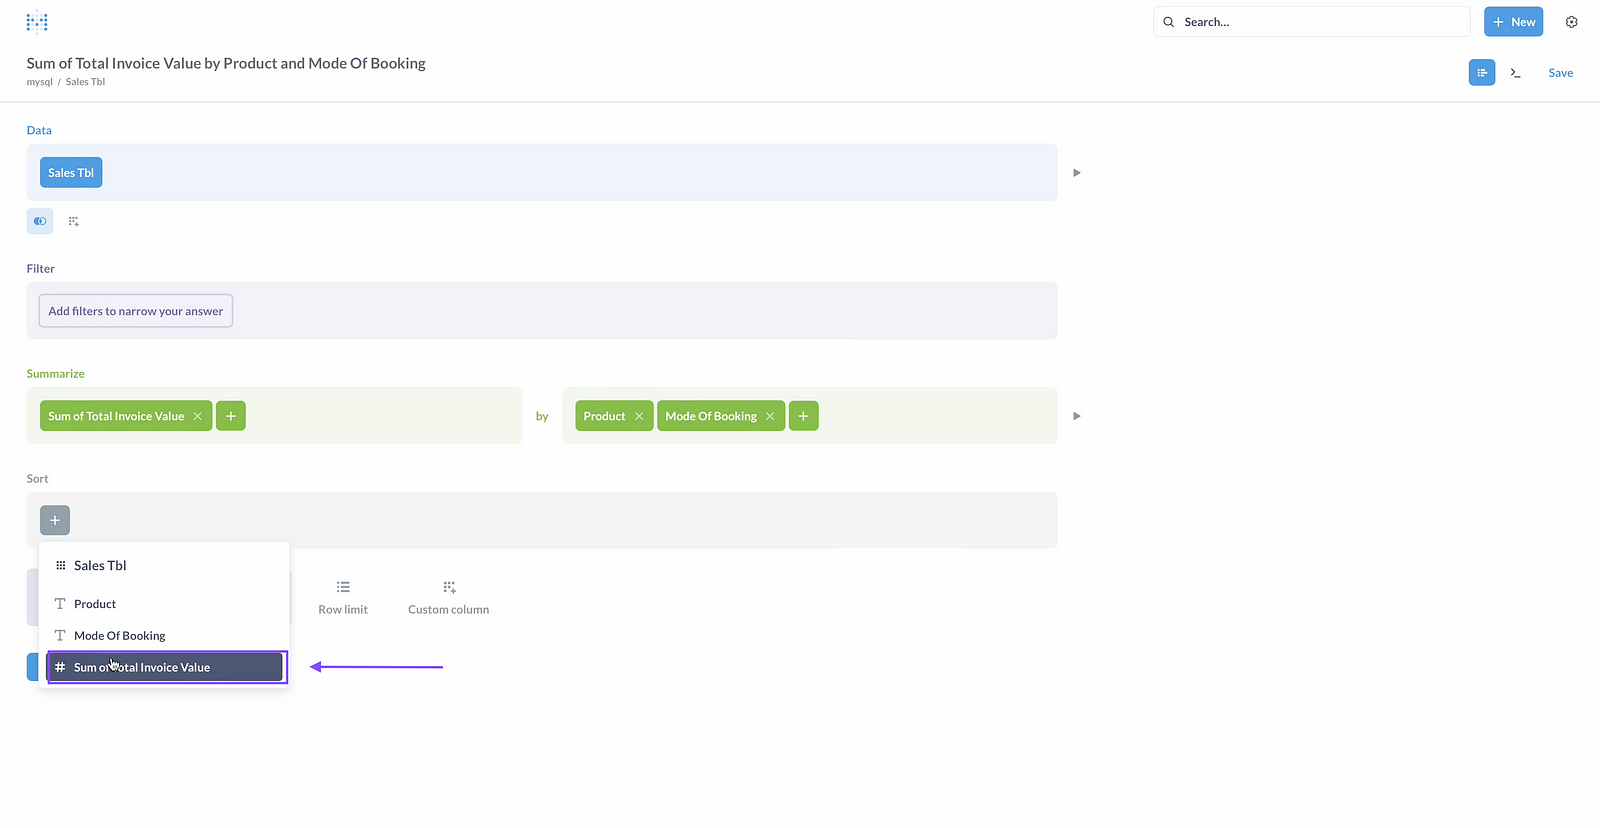
Step 09: Click on sort, if you need to sort the results.
Step 10:choose the column to sort by.
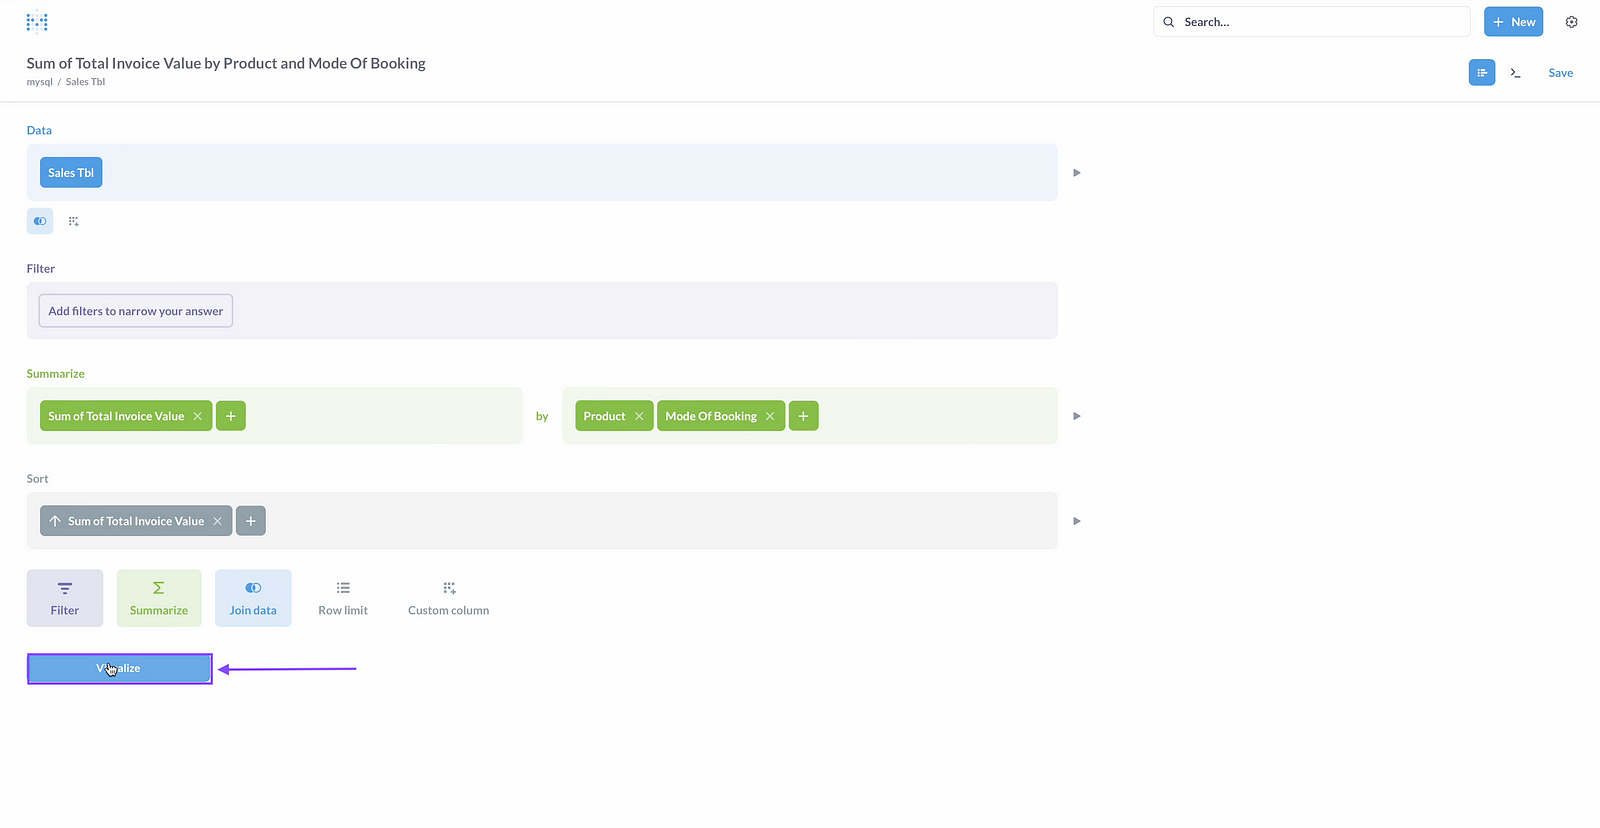
Step 11: Click on Visualize
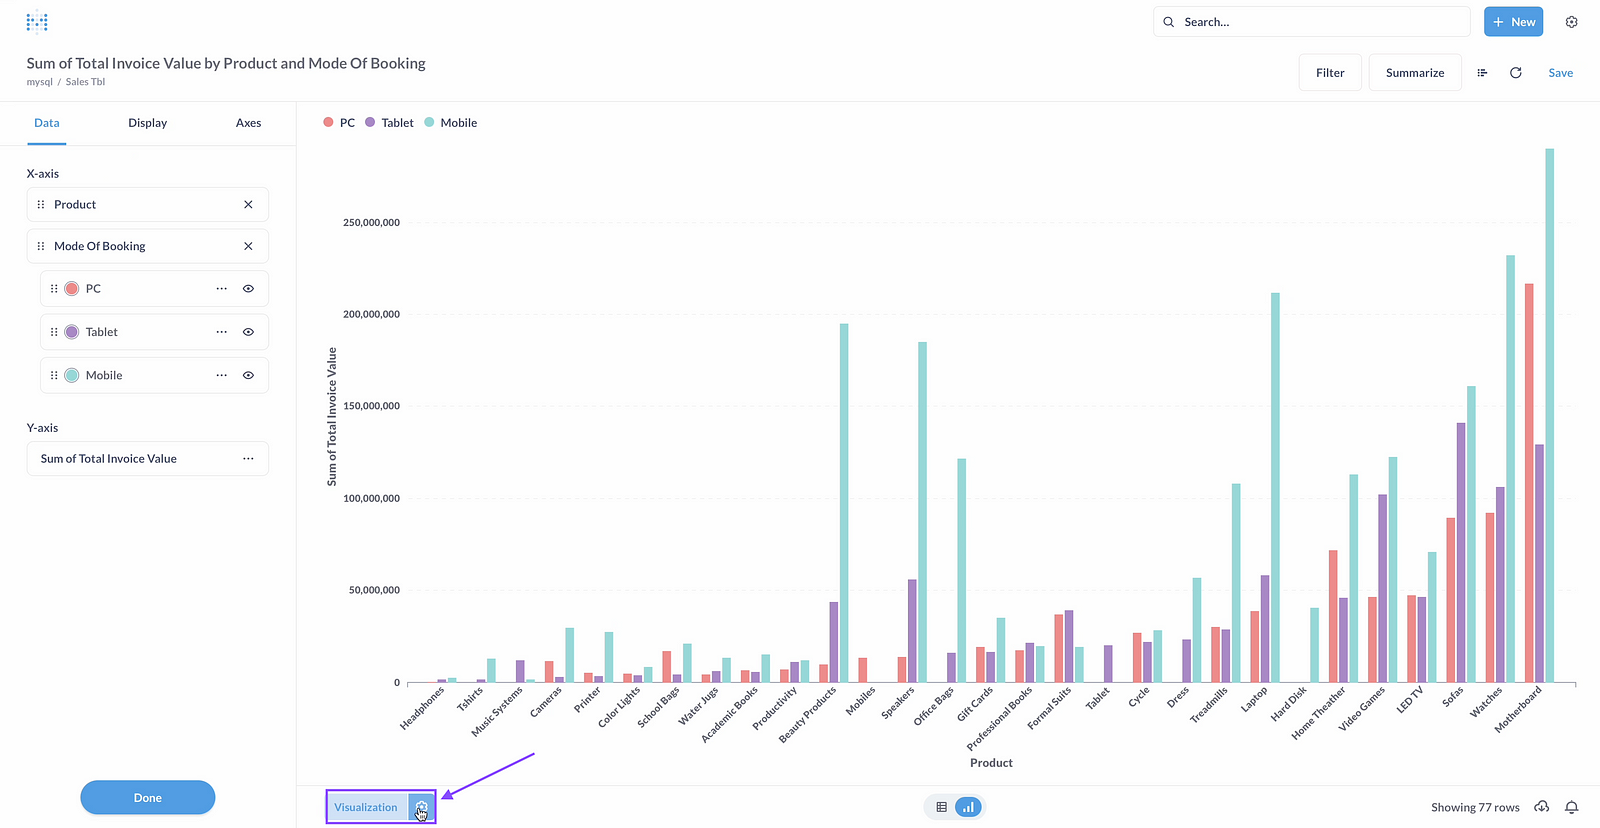
Step 12: Click on setting in visualization tab
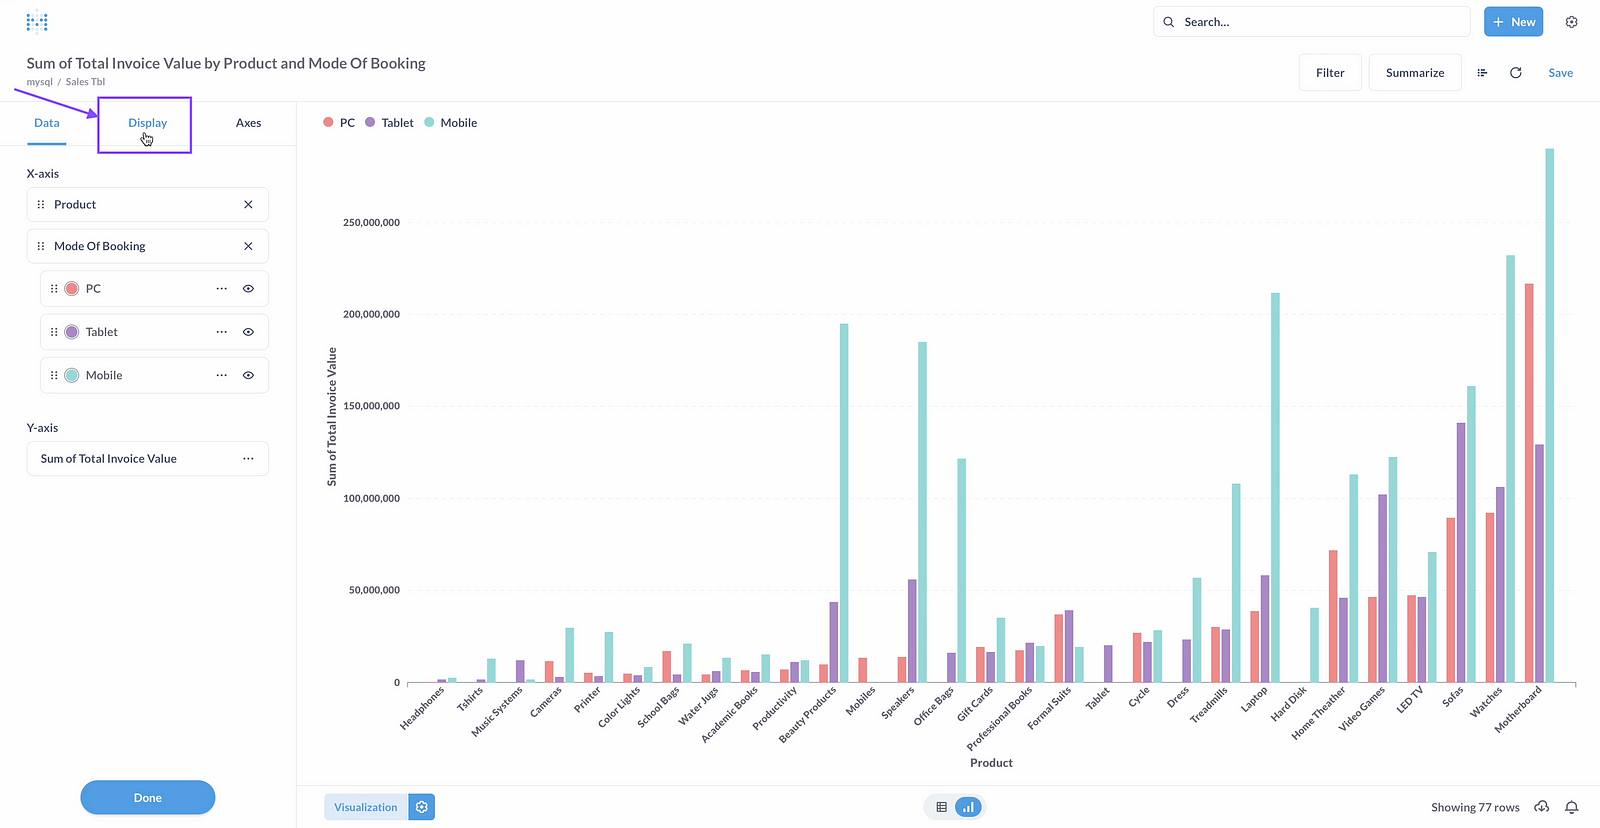
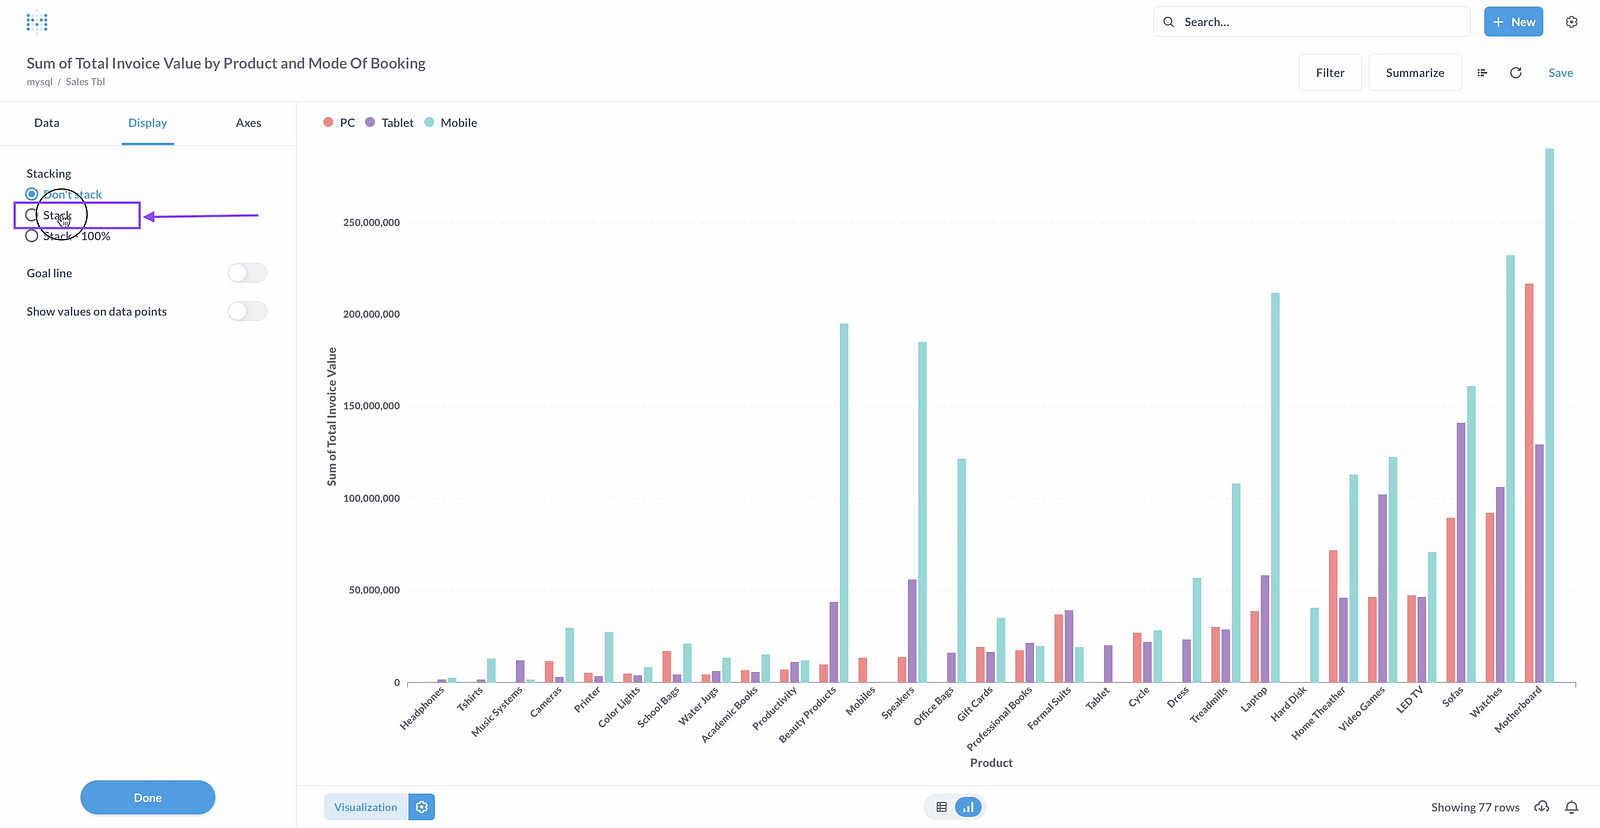
Step 13:Click on Display
Step 14: Click on stacked.
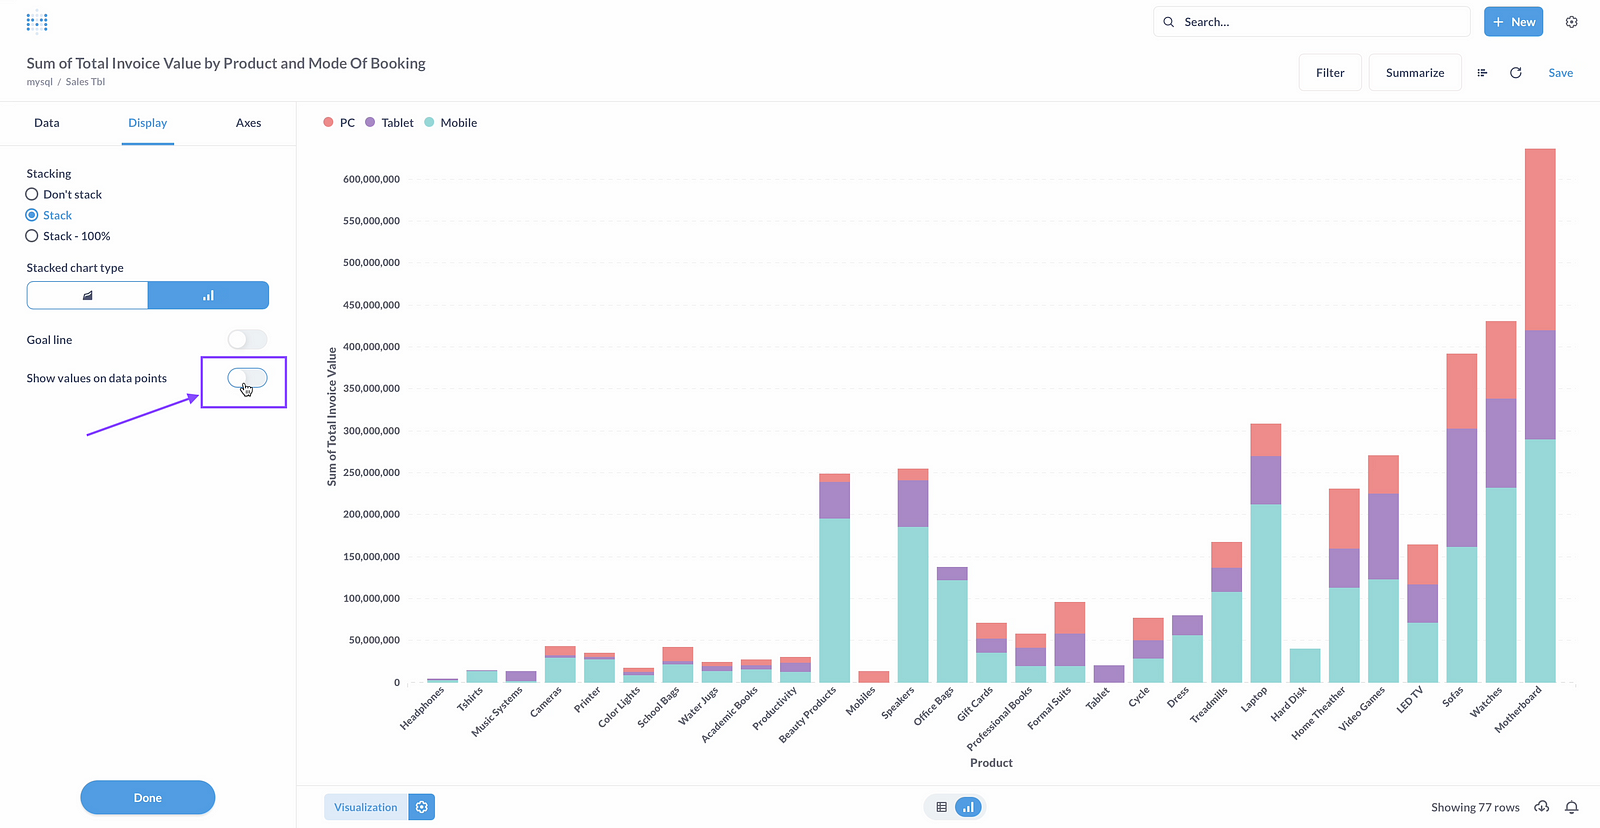
Step 15: Click on show values on data points
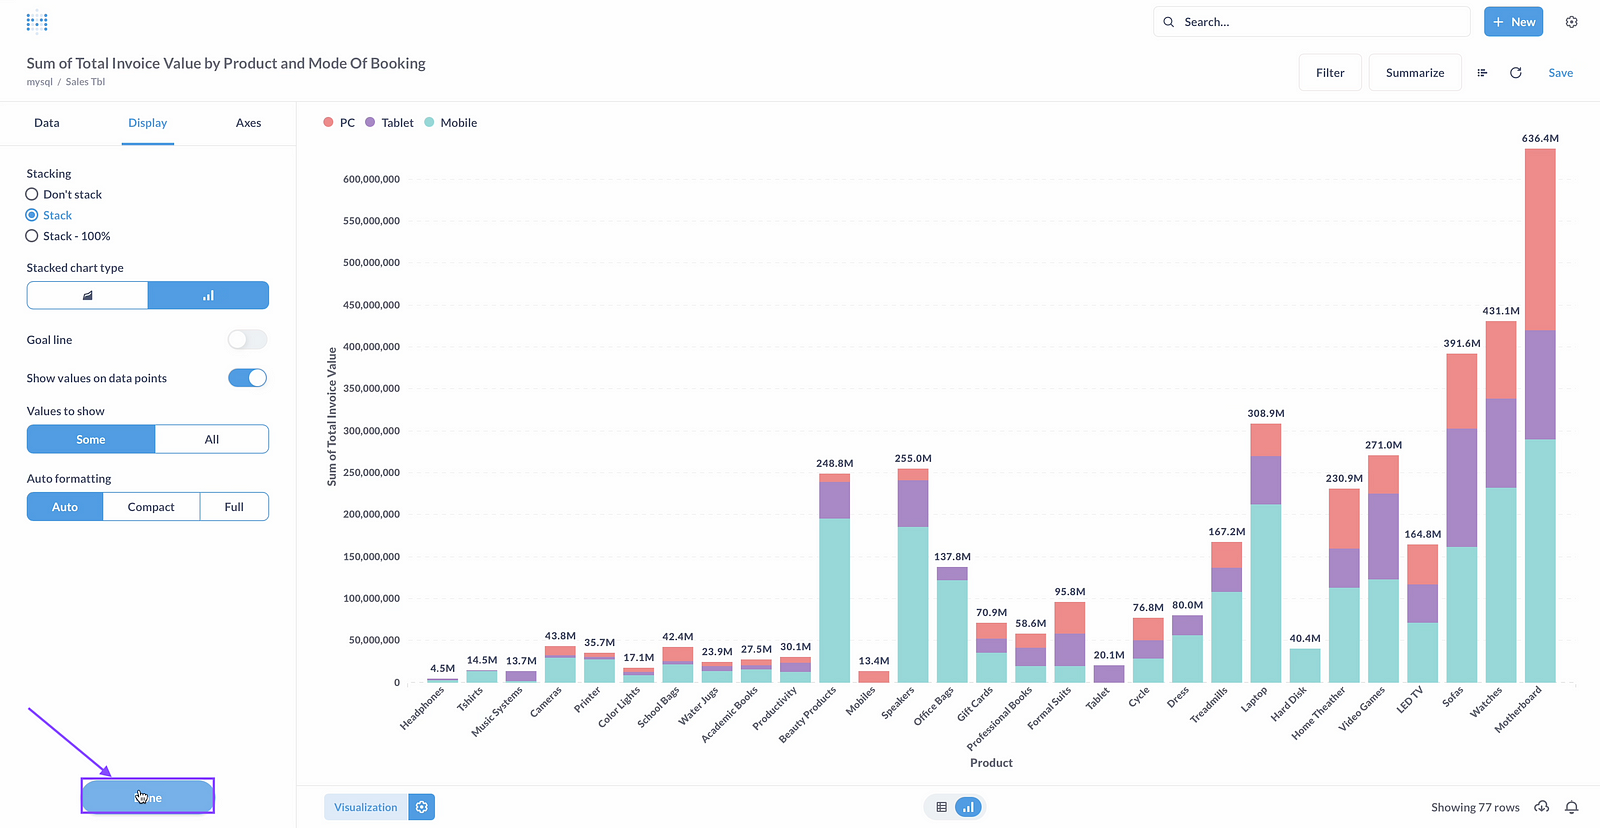
Step 16: Click on Done
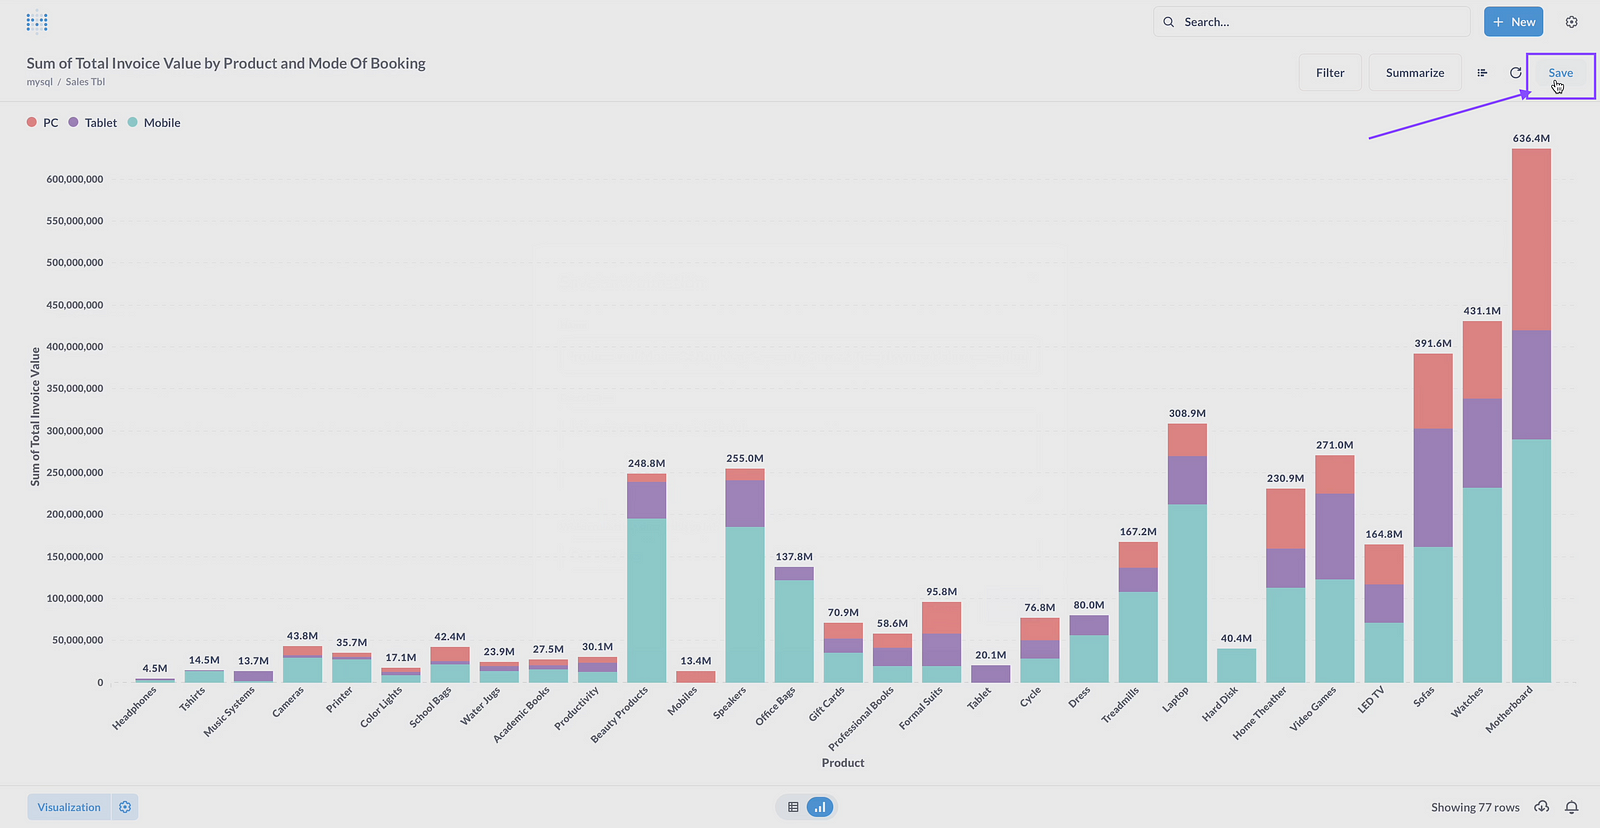
Step 17: Click on Save
Step 18: Give the name of chart and collection where this chart will be saved
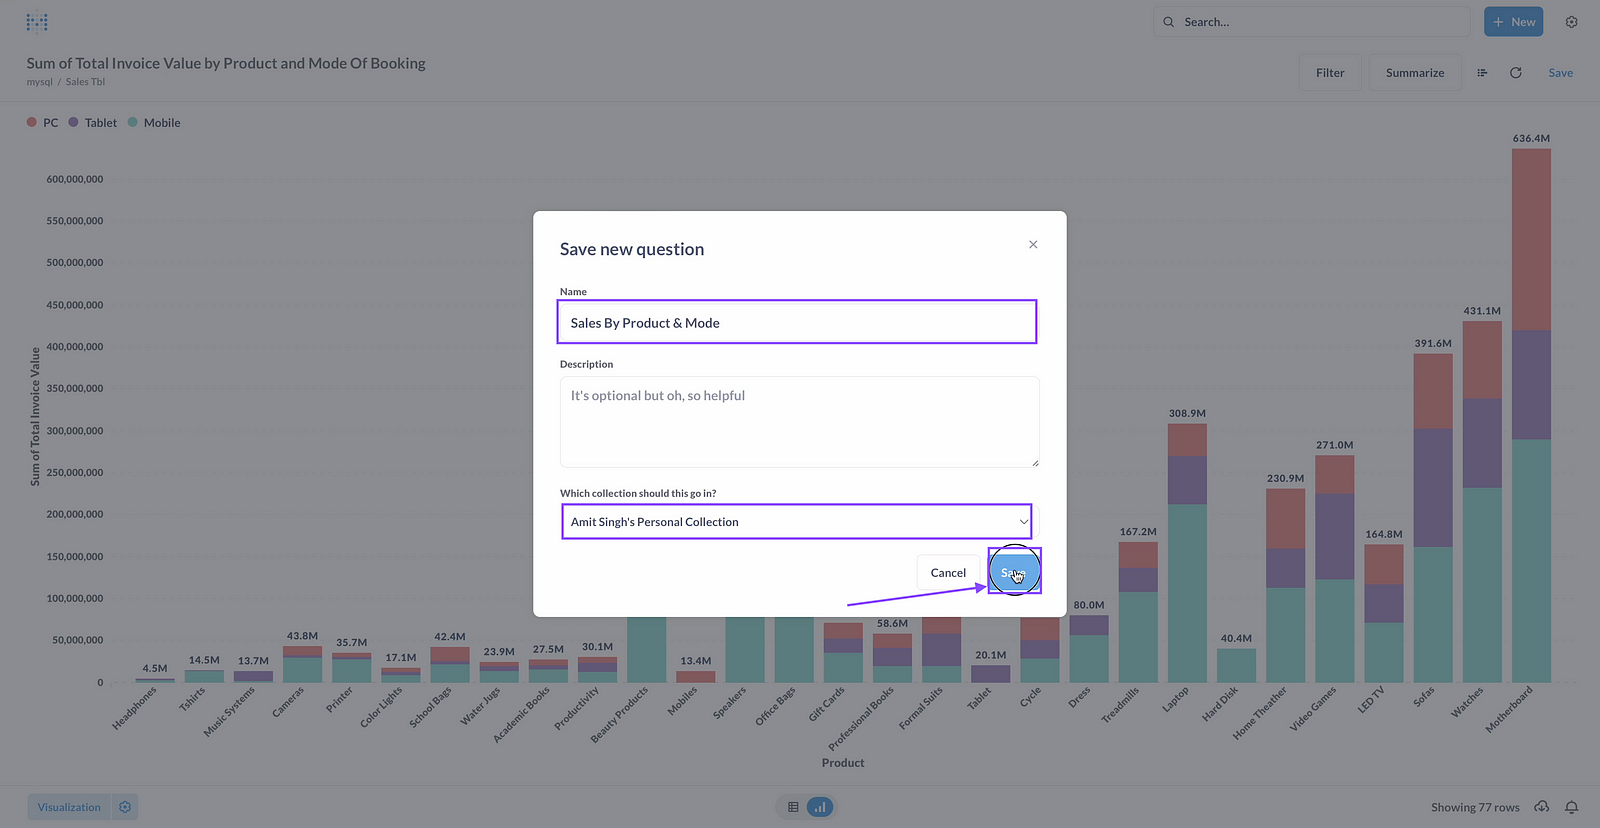
Step 19: Click on save
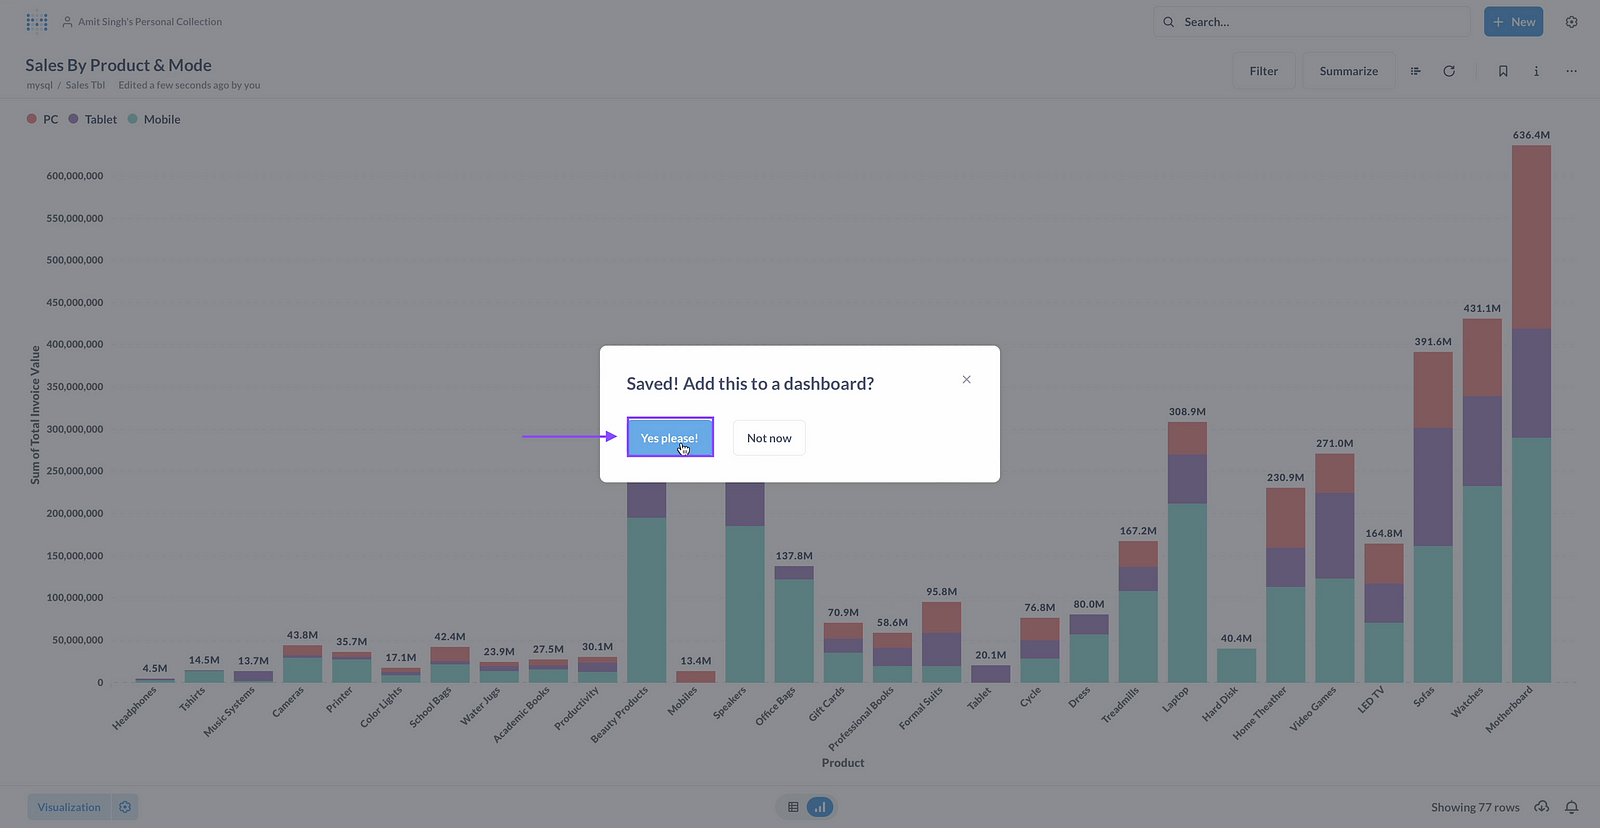
Step 20: Confirm adding this chart to Dashboard
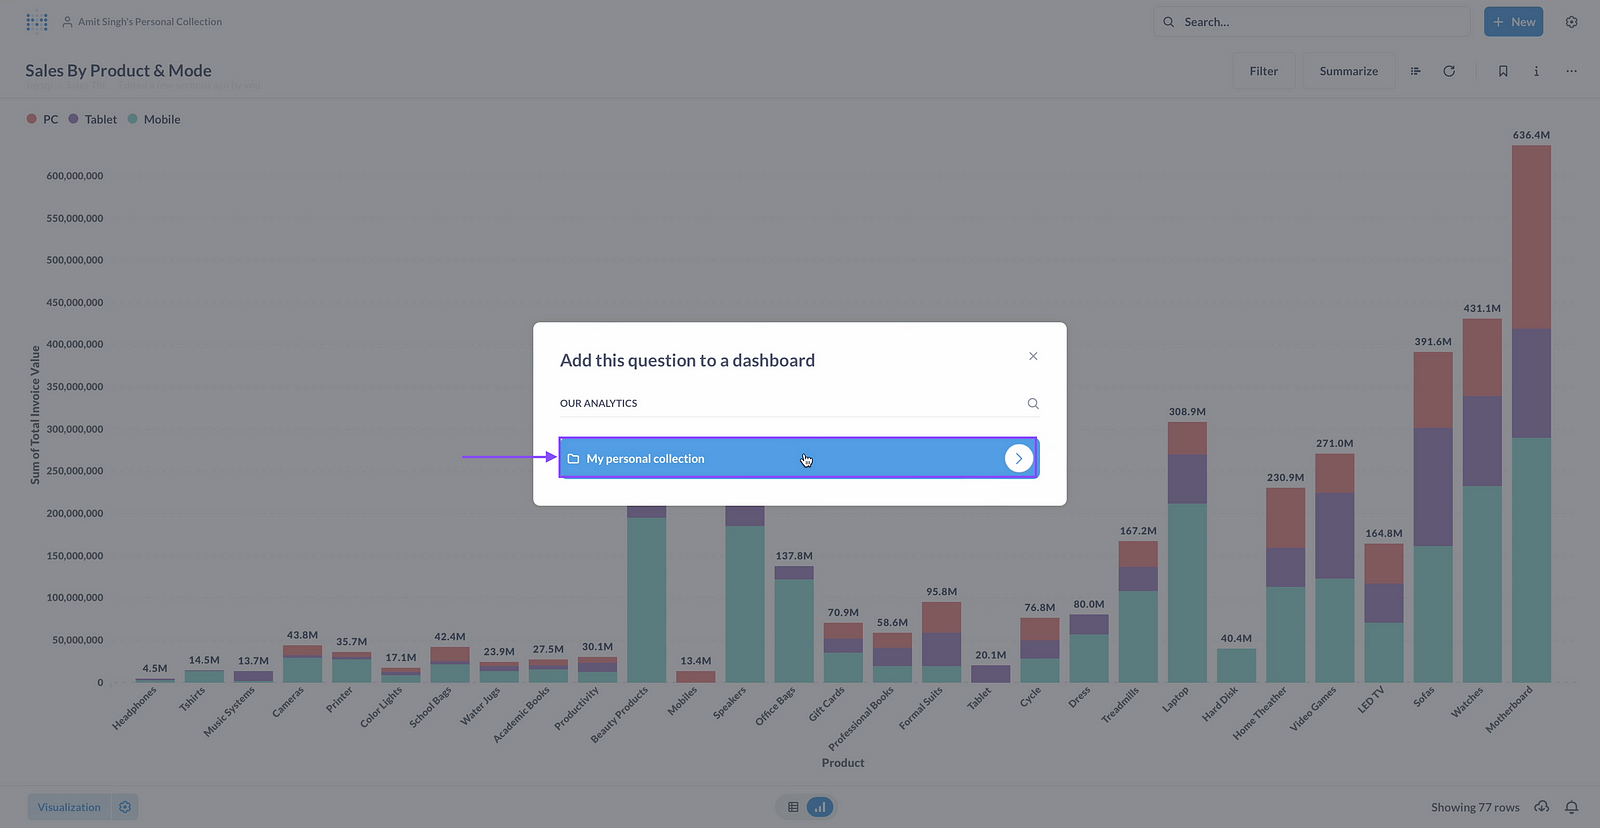
Step 21: Click to add this to existing dashboard or create new dashboard

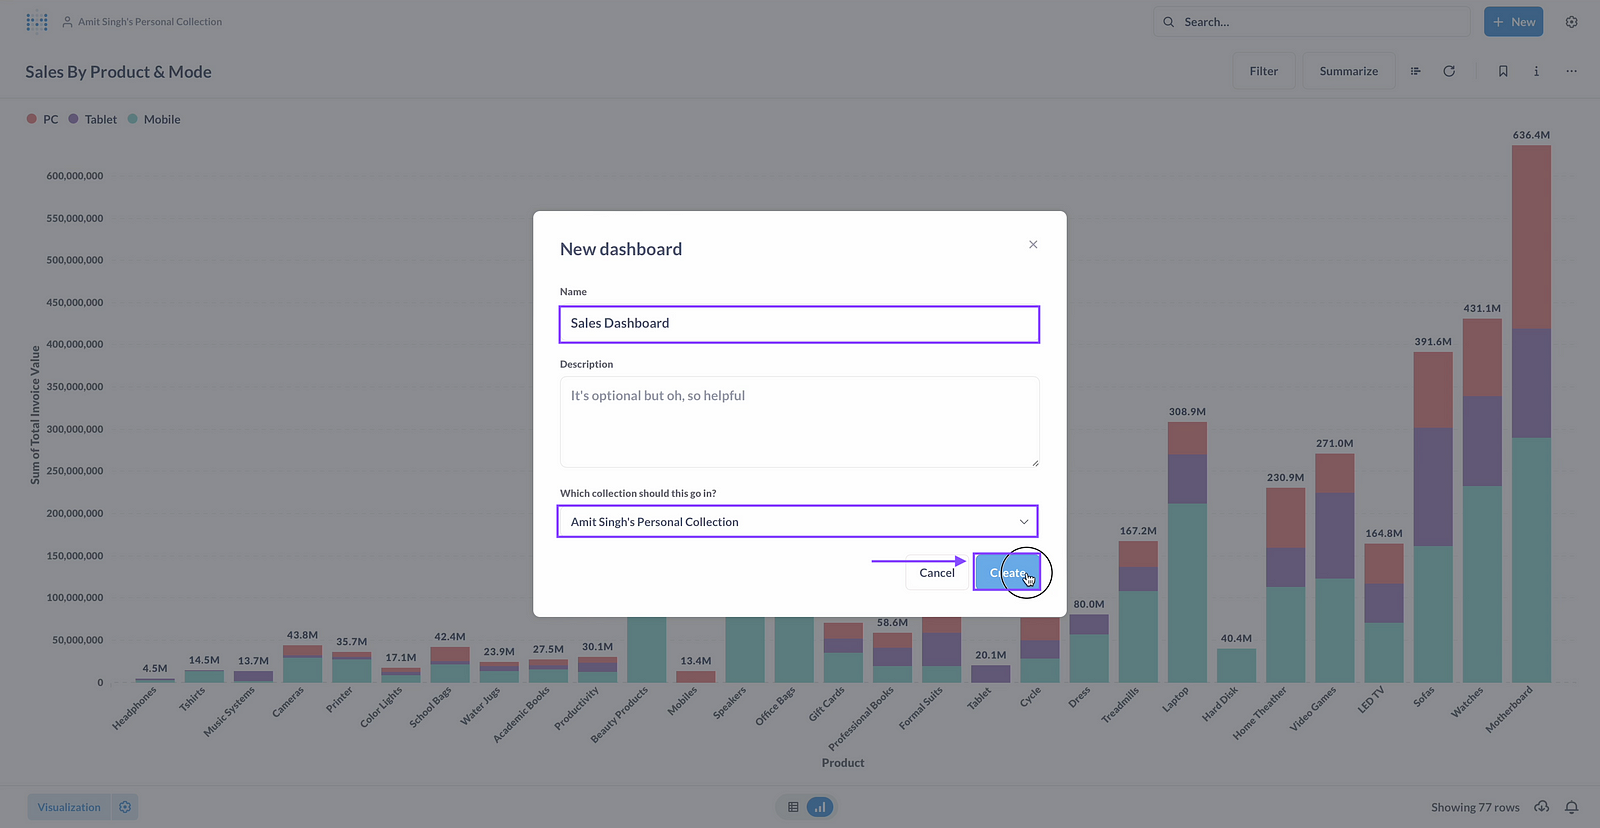
Step 22: Give name of Dashboard and Click on Create.
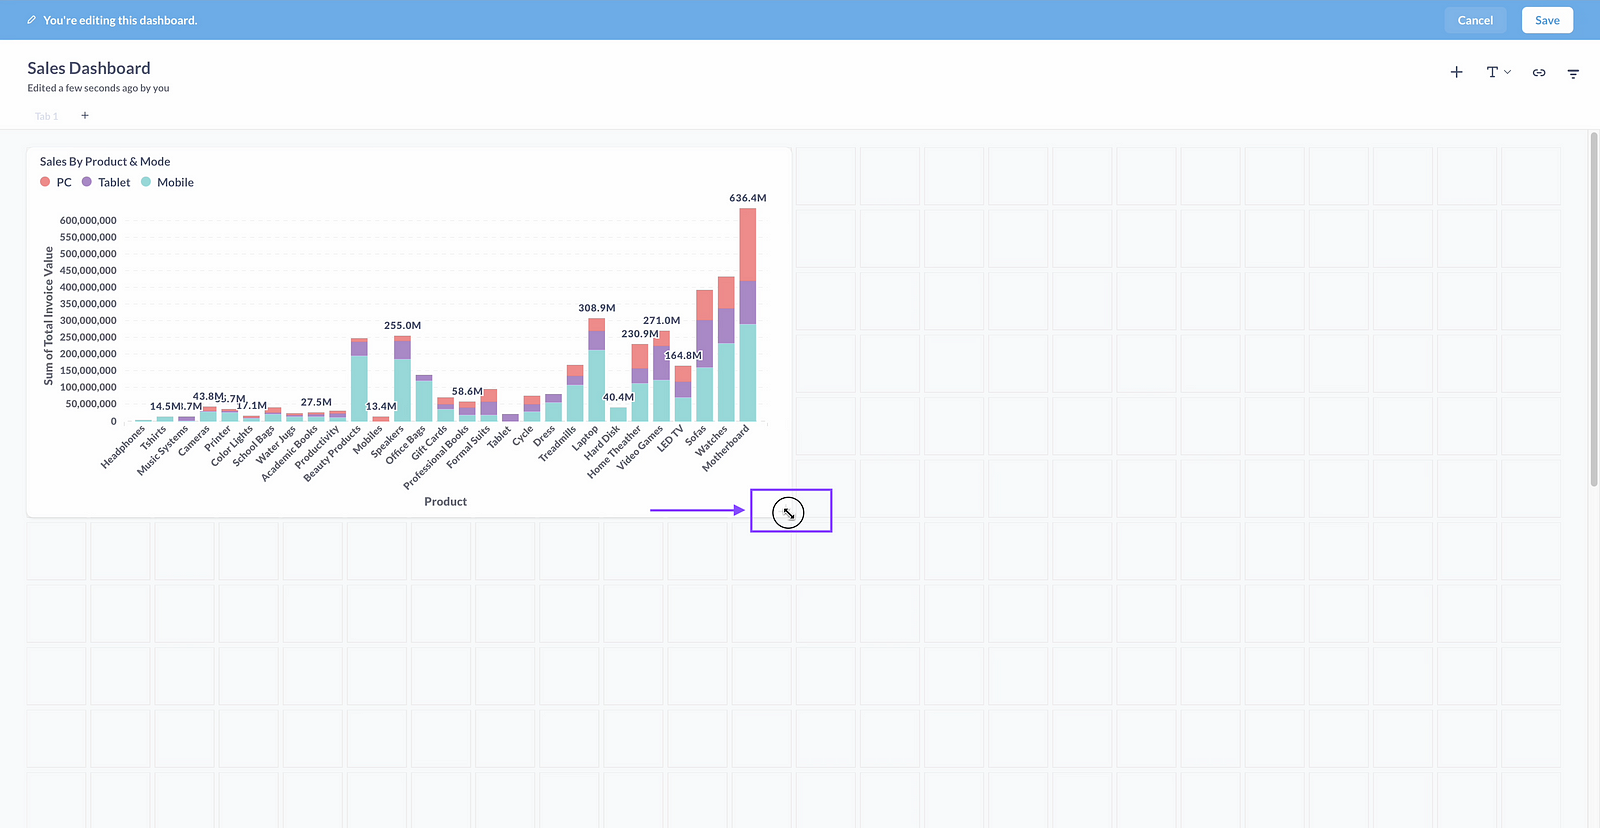
Step 23: Click to Enlarge or reduce the chart size.
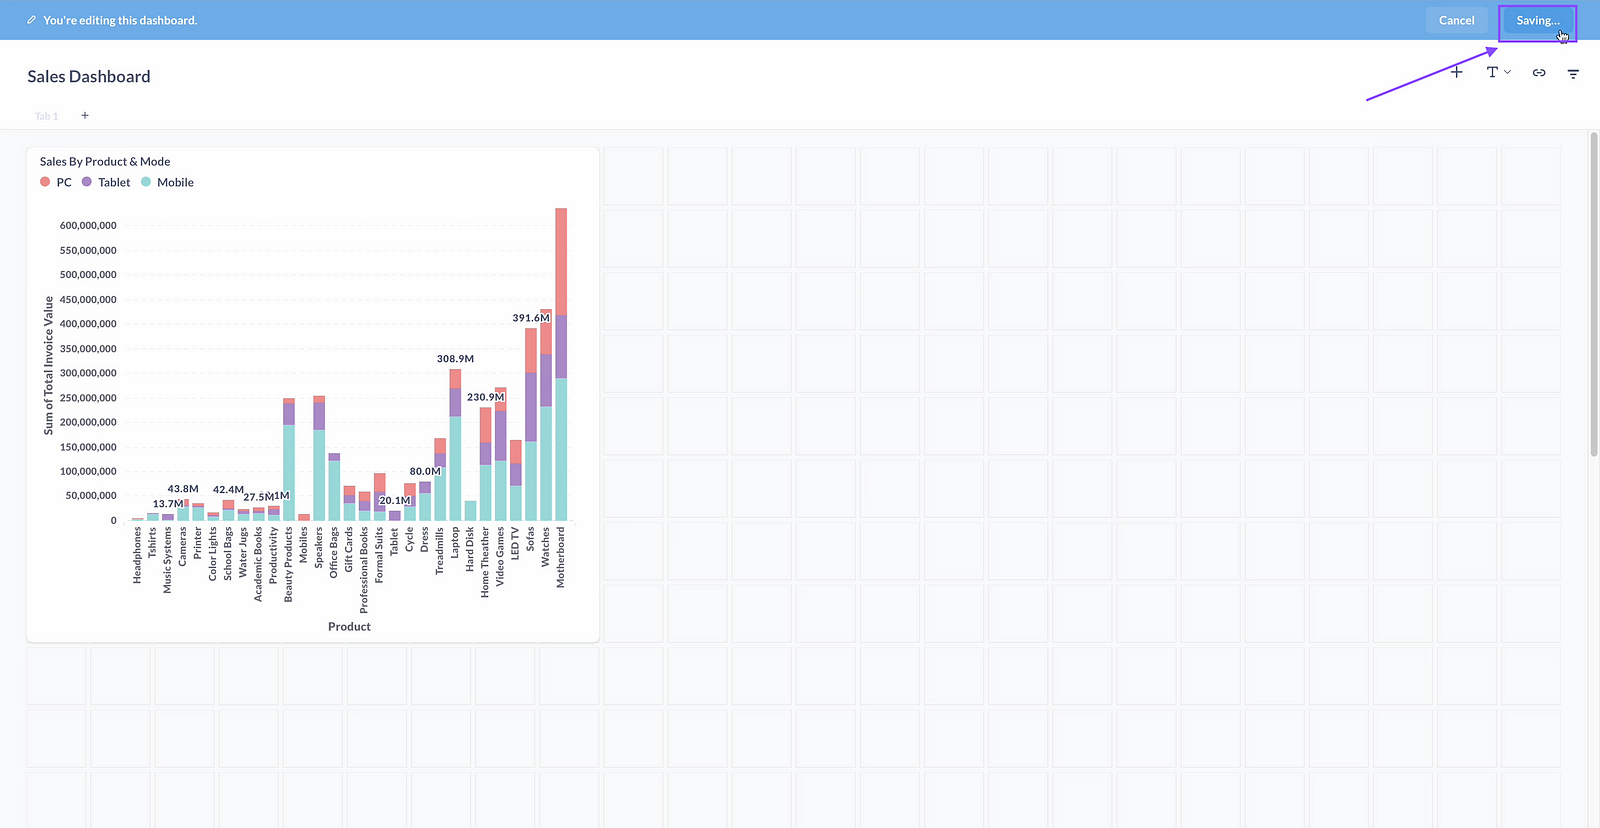
Step 24: Click on save.
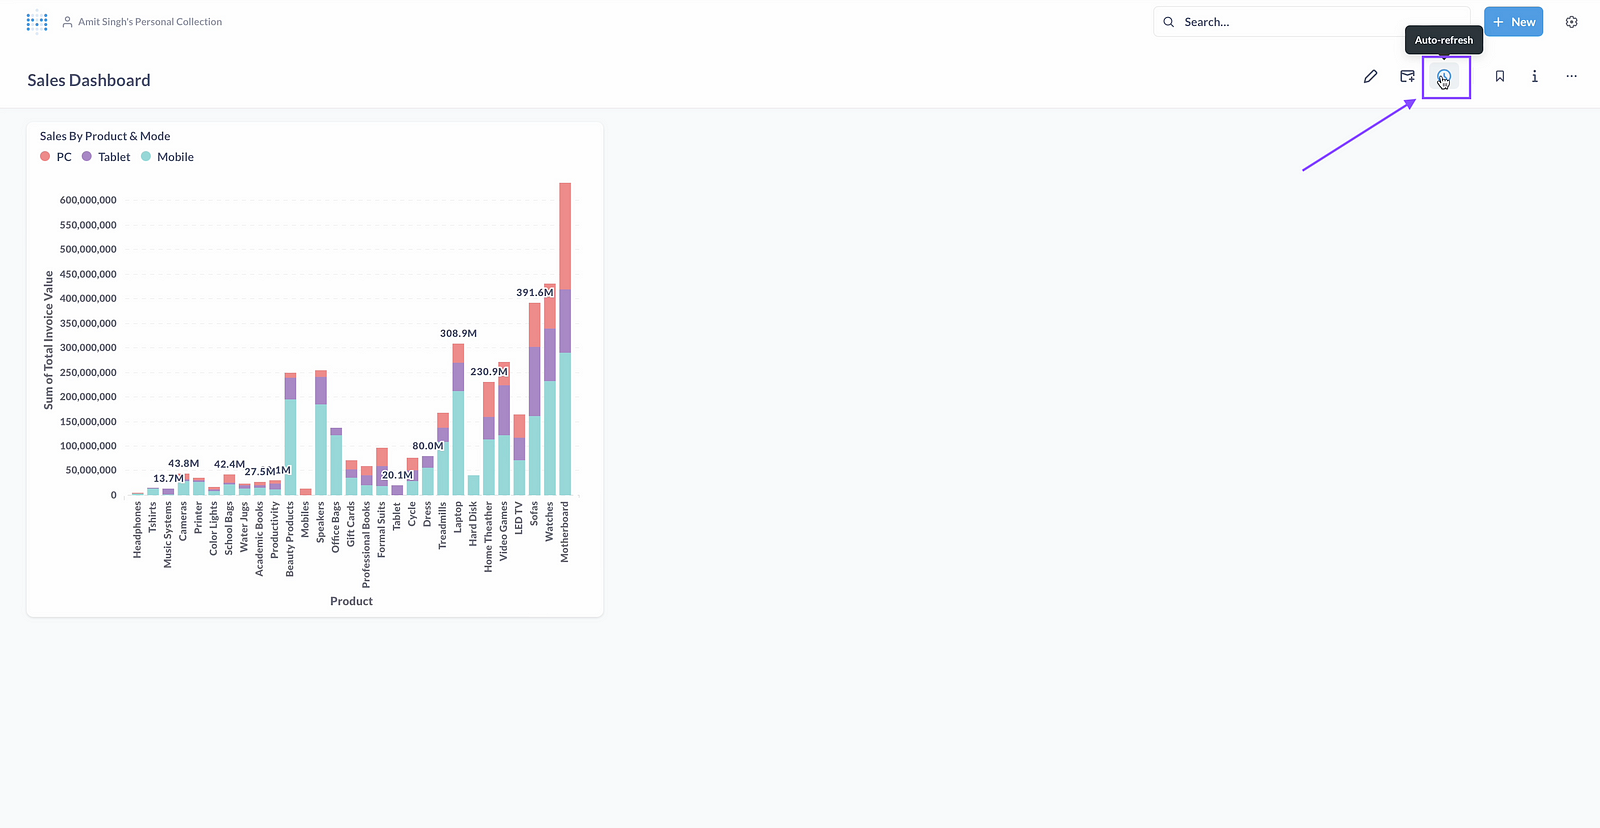
Step 25: Click on auto refresh.
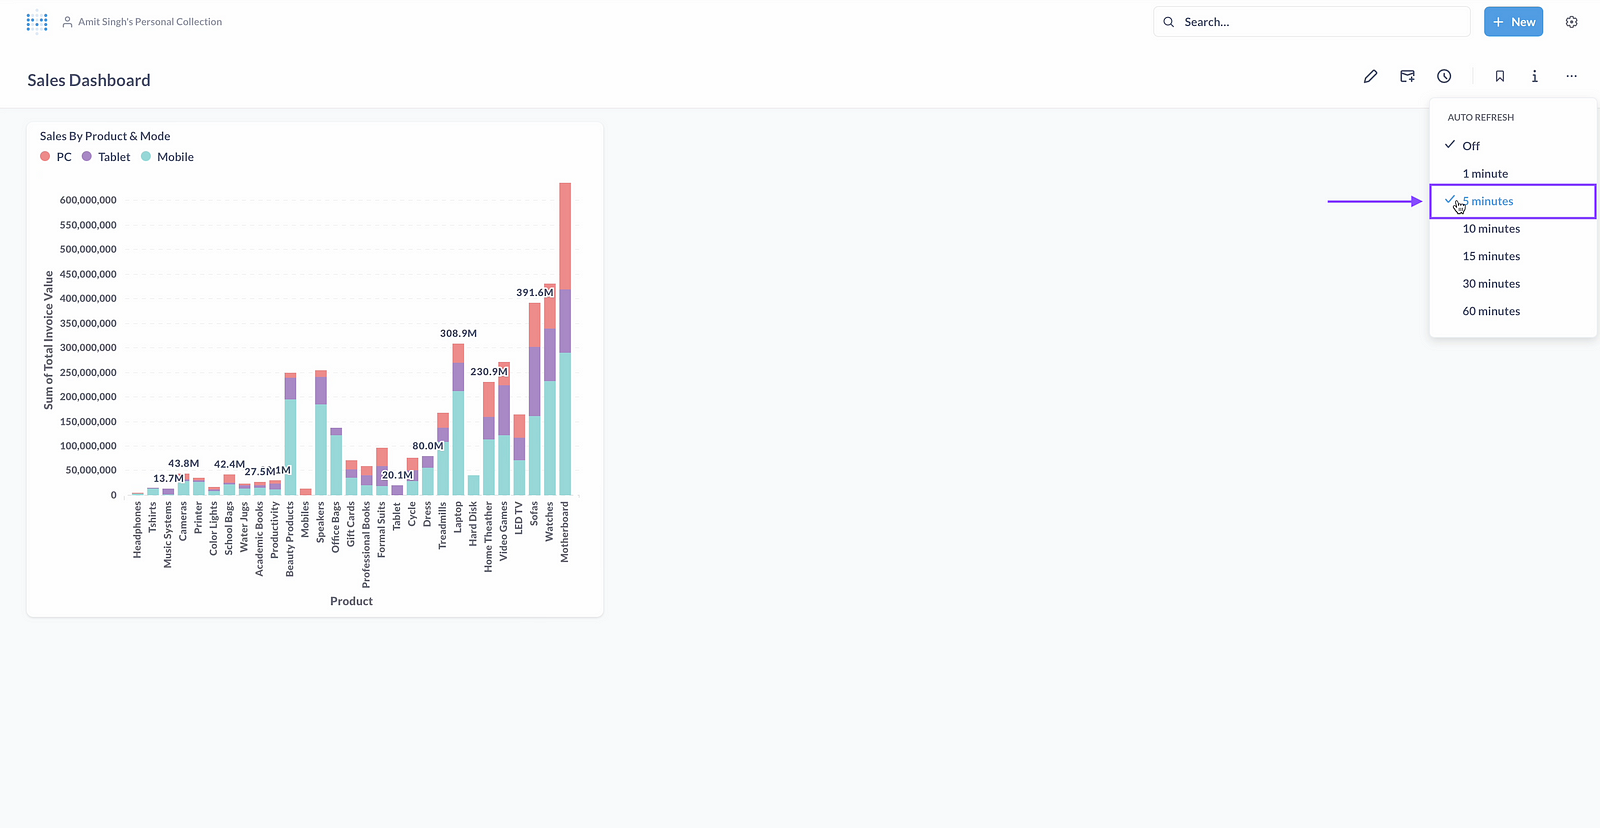
Step 26: choose auto refresh schedule.
Step 27: Click on 3 dots
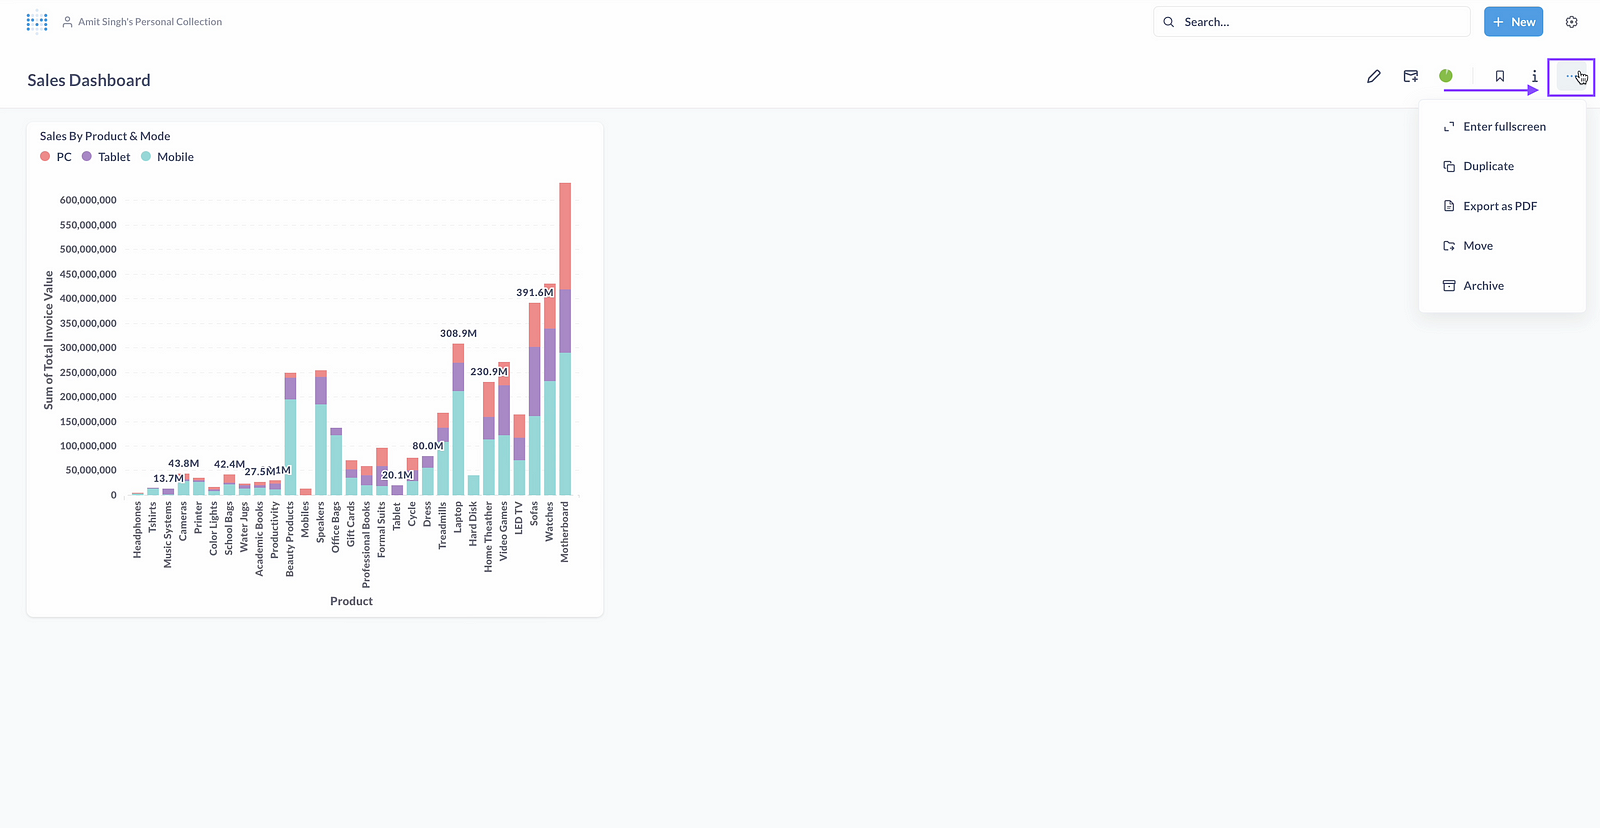
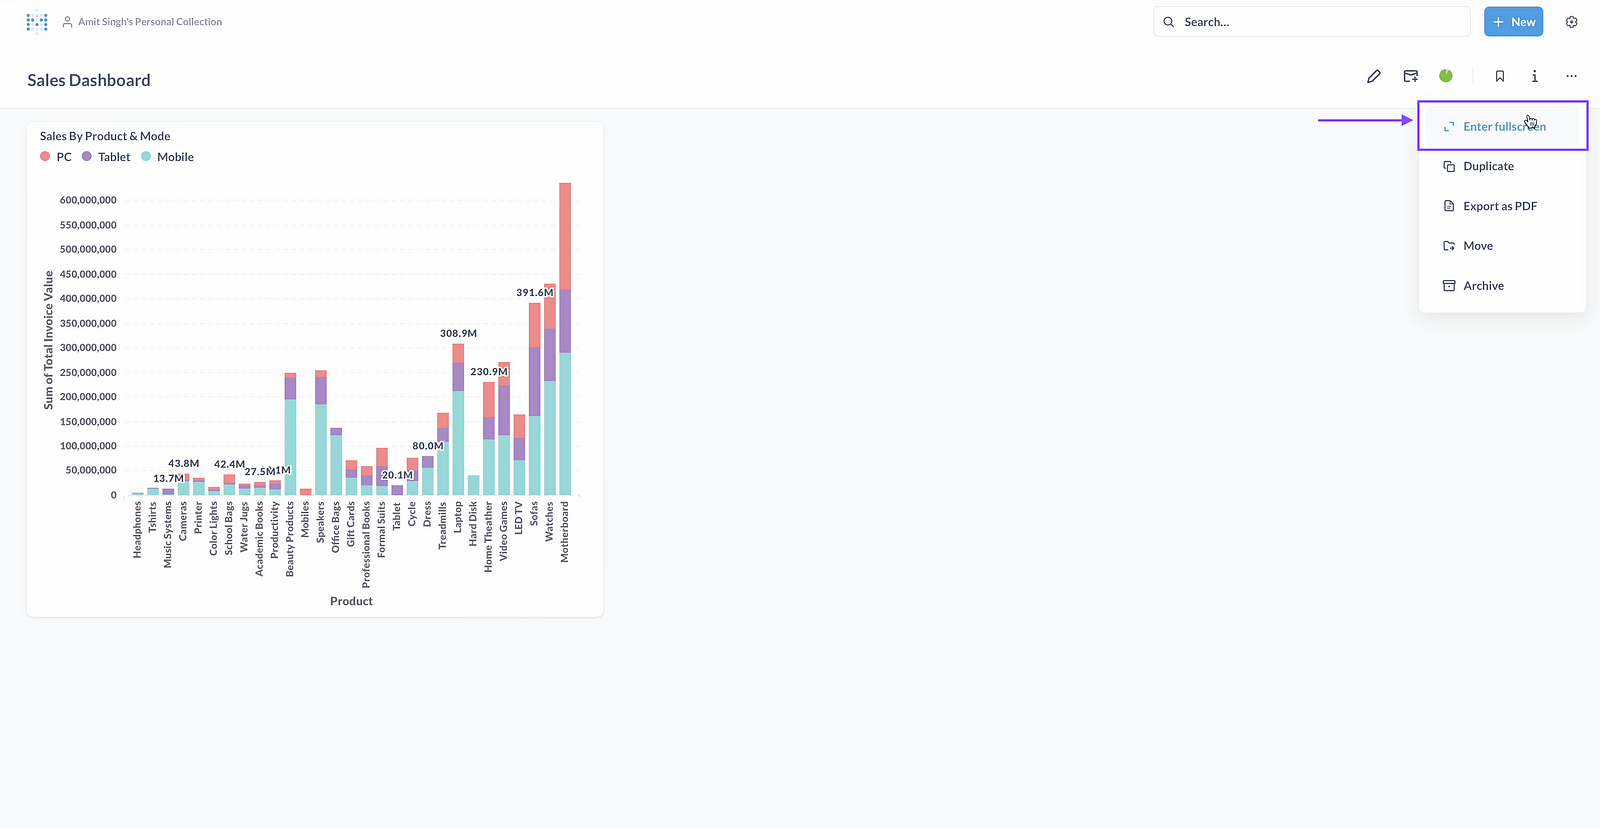
Step 28: Click on Full screen
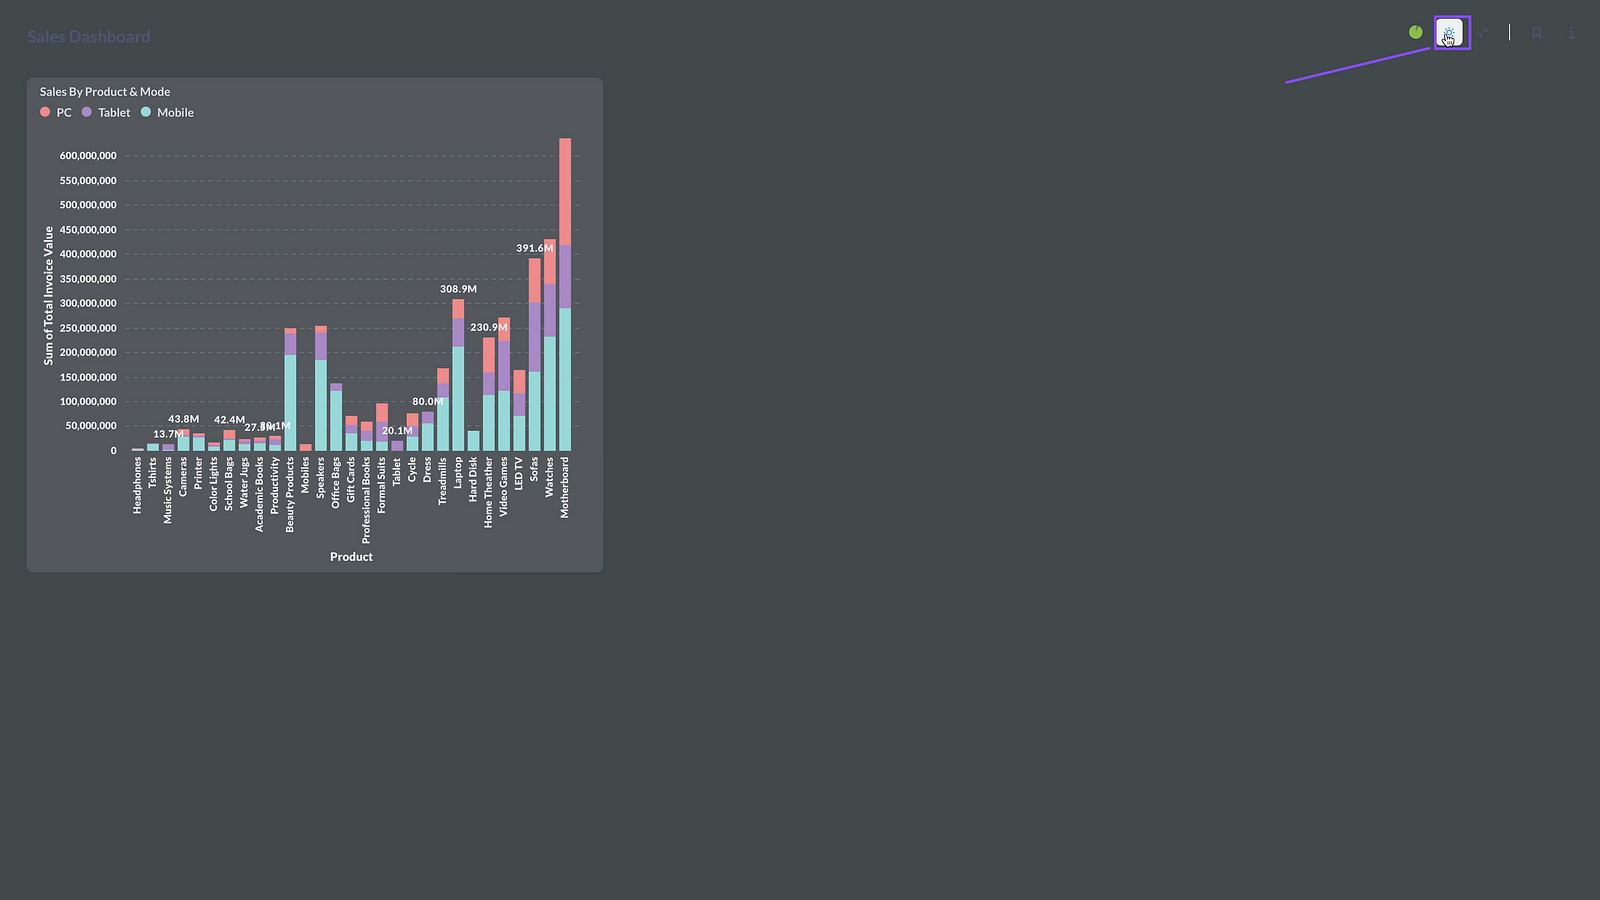
Step 29 Click on Night Mode
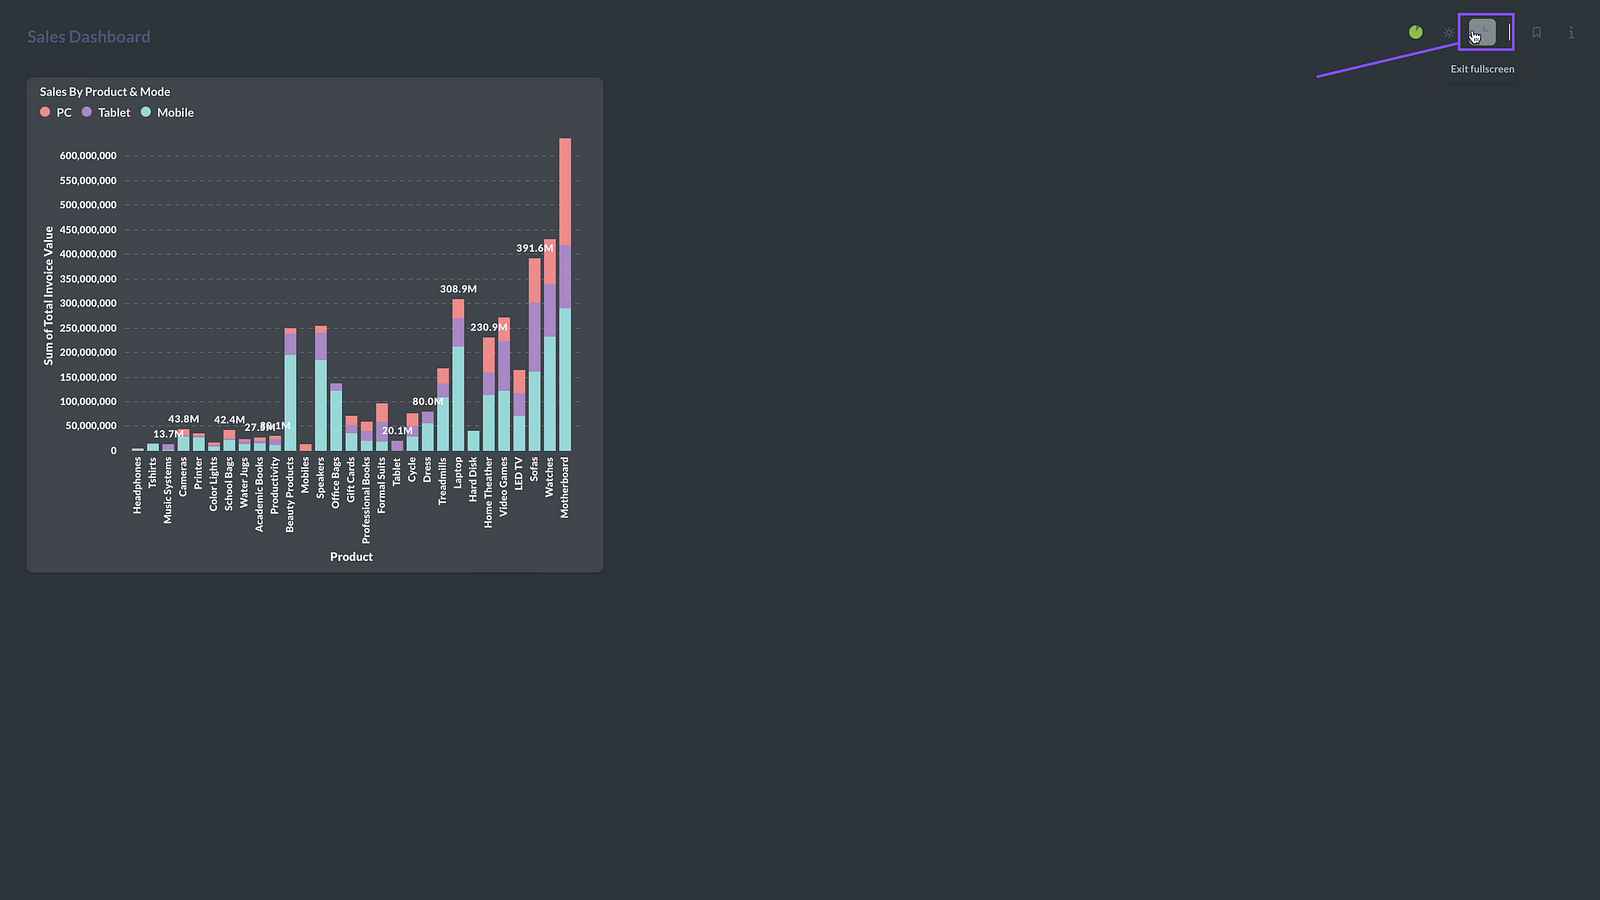
Step 30: Click on Exit full screen
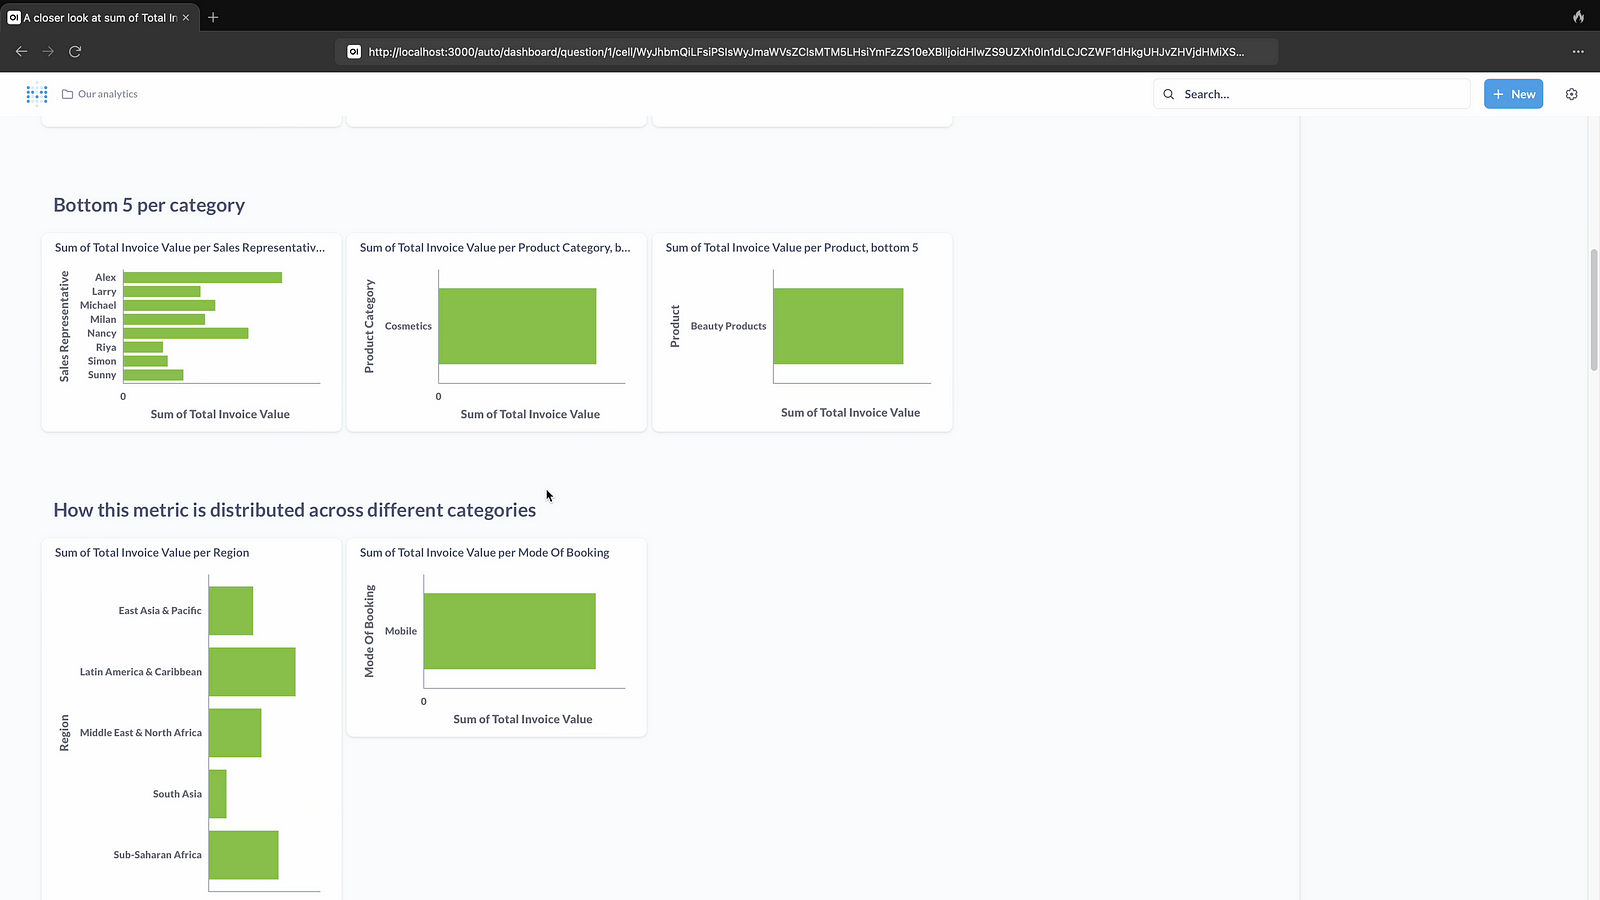
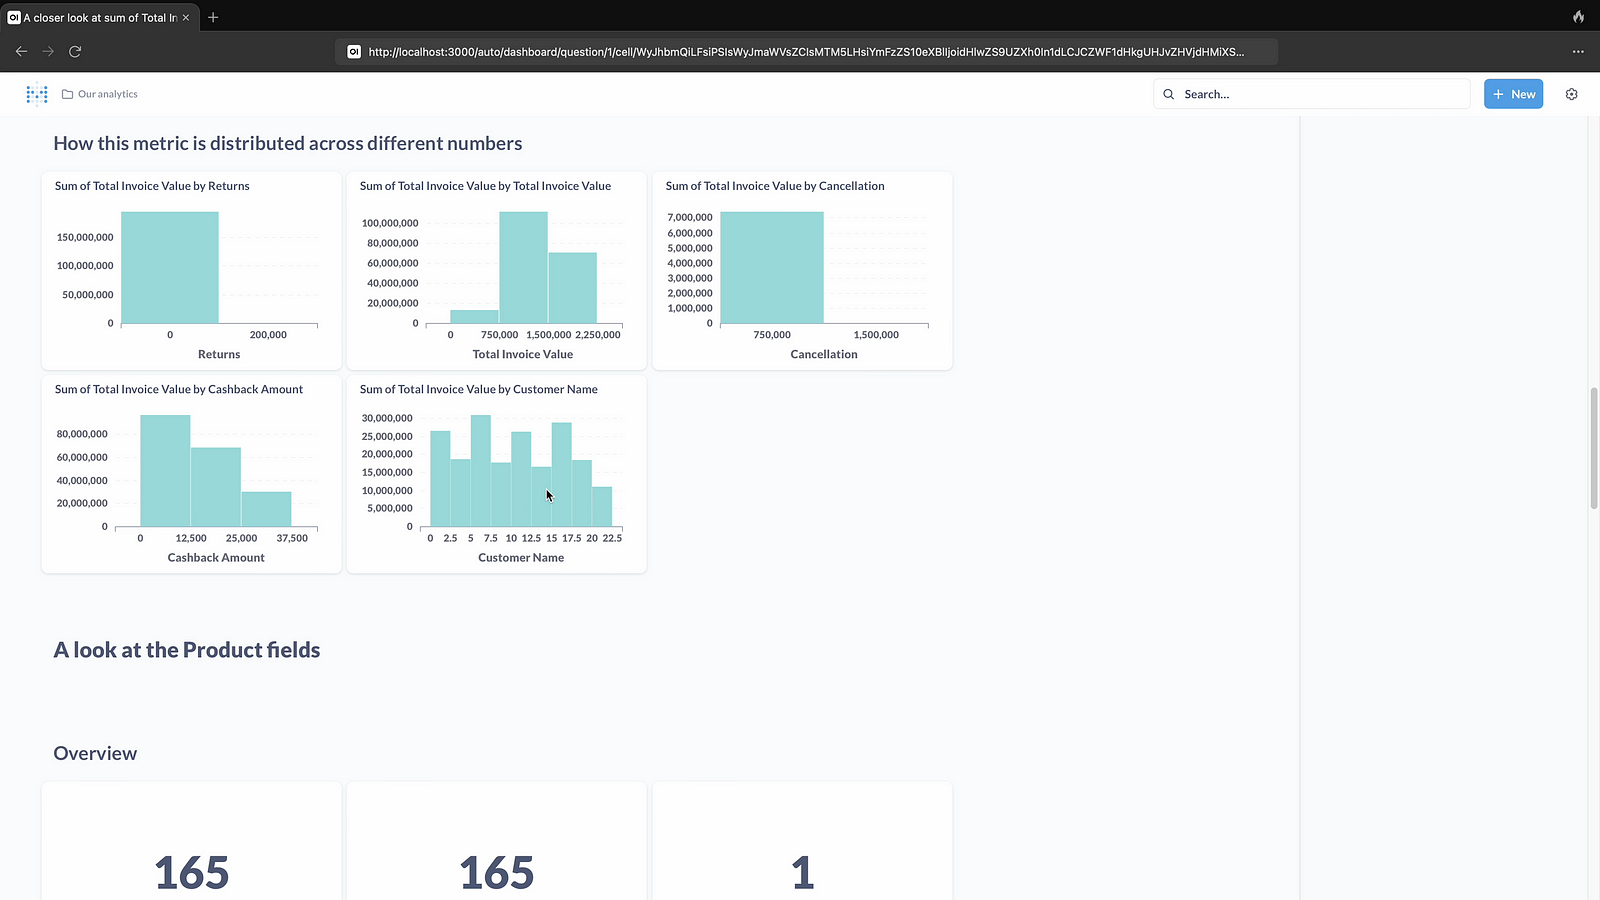
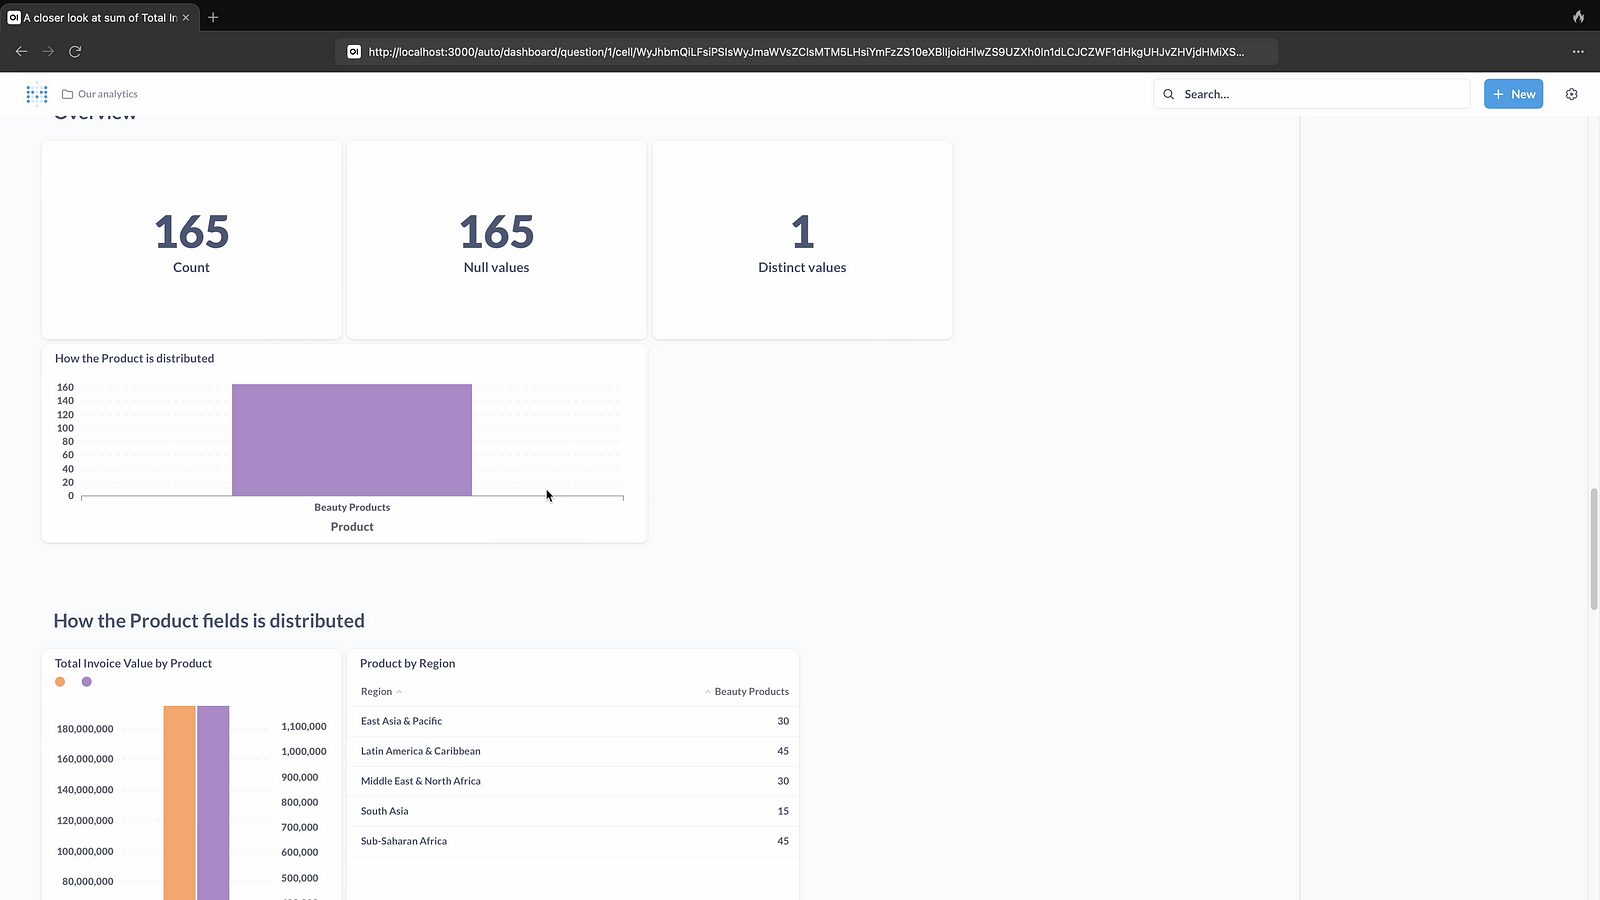
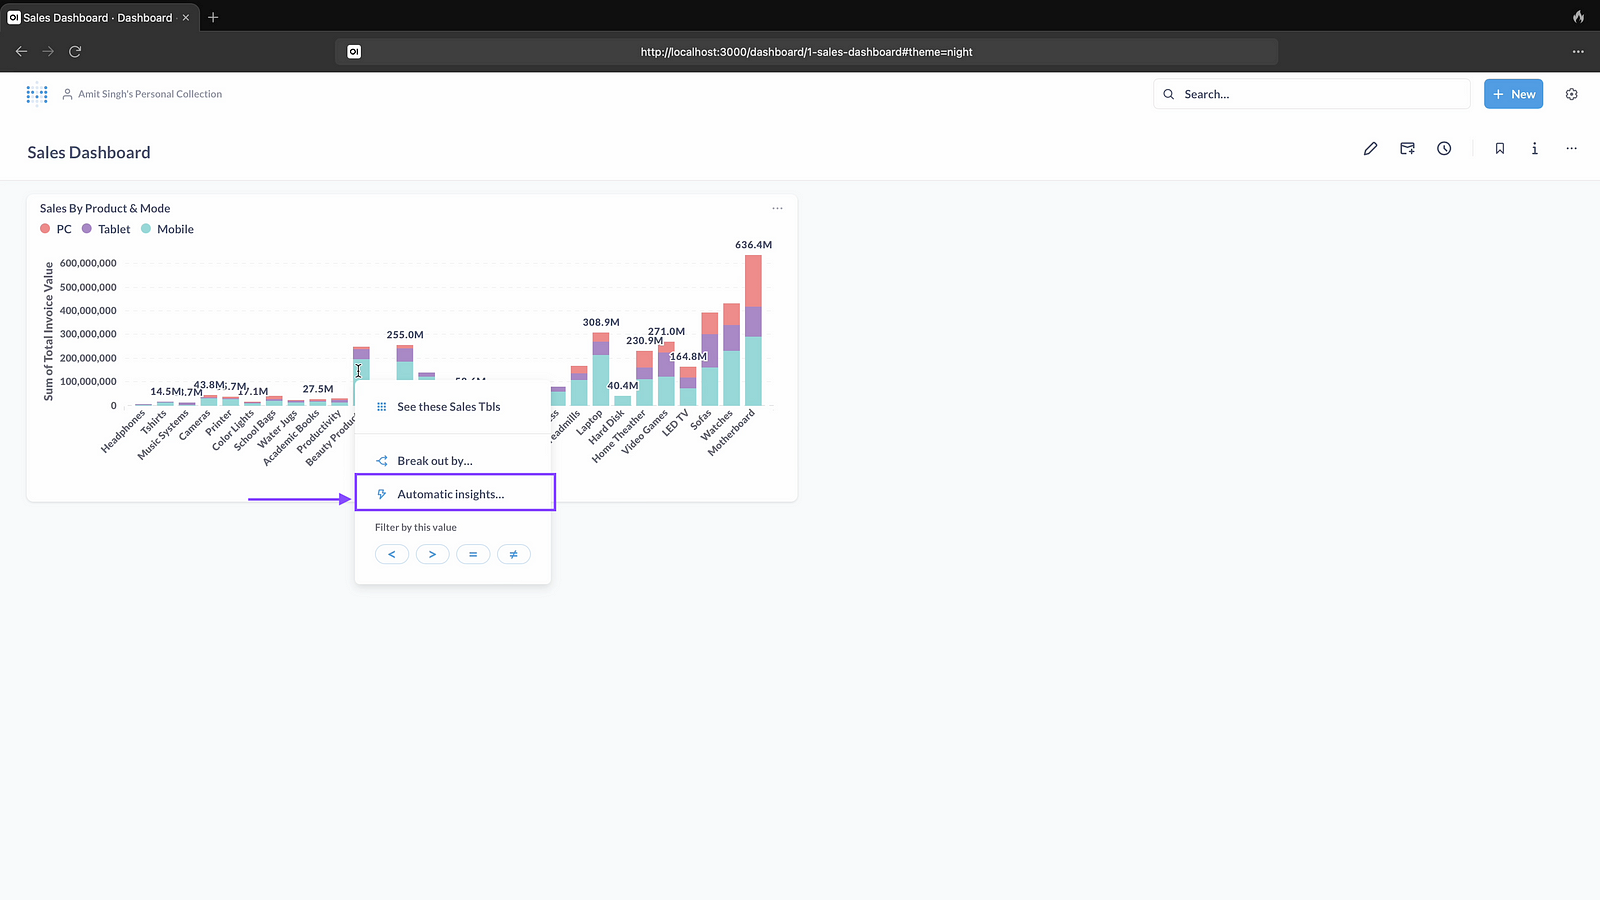
Step 31: Right click on chart to get automated insights
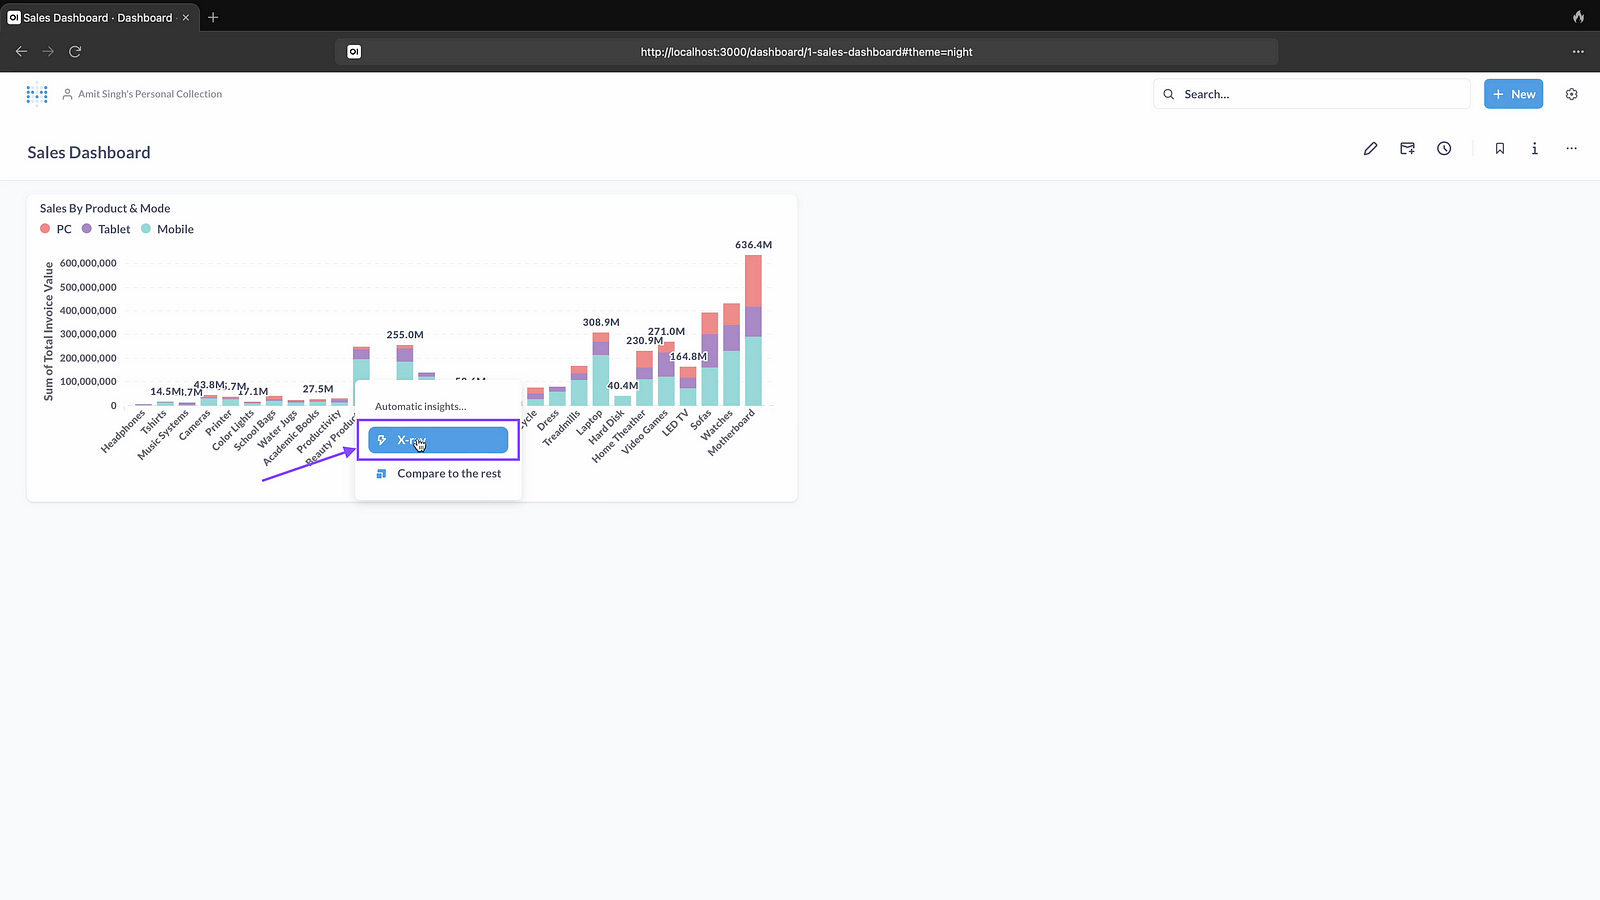
Step 32: Click on Xray
Step 33: Here is automated insights