Learn to talk with your Excel and Create Automated Visualization in Natural Language
https://github.com/Sinaptik-AI/pandas-ai
Chat with your database (SQL, CSV, pandas, polars, mongodb, noSQL, etc). PandasAI makes data analysis conversational using LLMs (GPT 3.5 / 4, Anthropic, VertexAI) and RAG.
Ollama: Large Language Model Runner.
https://github.com/ollama/ollama
https://hub.docker.com/r/ollama/ollama
https://github.com/ollama/ollama-python
https://github.com/ollama/ollama-js
Now here is how to get started Quickly with Excel.
Step 01: Now first install PandasAI Excel connector by typing below command
%pip install 'pandasai[excel]'

Step 2: Now connect Ollama llama3 llm with below command
from pandasai import SmartDataframe
from pandasai.llm.local_llm import LocalLLM
ollama_llm = LocalLLM(api_base="http://localhost:11434/v1", model="llama3") df = SmartDataframe("sales01.xlsx", config={"llm": ollama_llm})

Step 03: Now Connect your Excel file and ask your first question in Natural language, Just change your excel name name instead of sales01.xlsx
import os
from pandasai import SmartDataframe
from pandasai. llm. local_ llm import LocalLLM

ollama_Ulm = LocalLLM(api_base="http://localhost:11434/vI", model="llama3")
sdf = SmartDataframe sales01.xlsx', config={ llm": ollama llm})
response = sdf.chat "How many entries do we have in sales0l.xlsx?")
print(response)
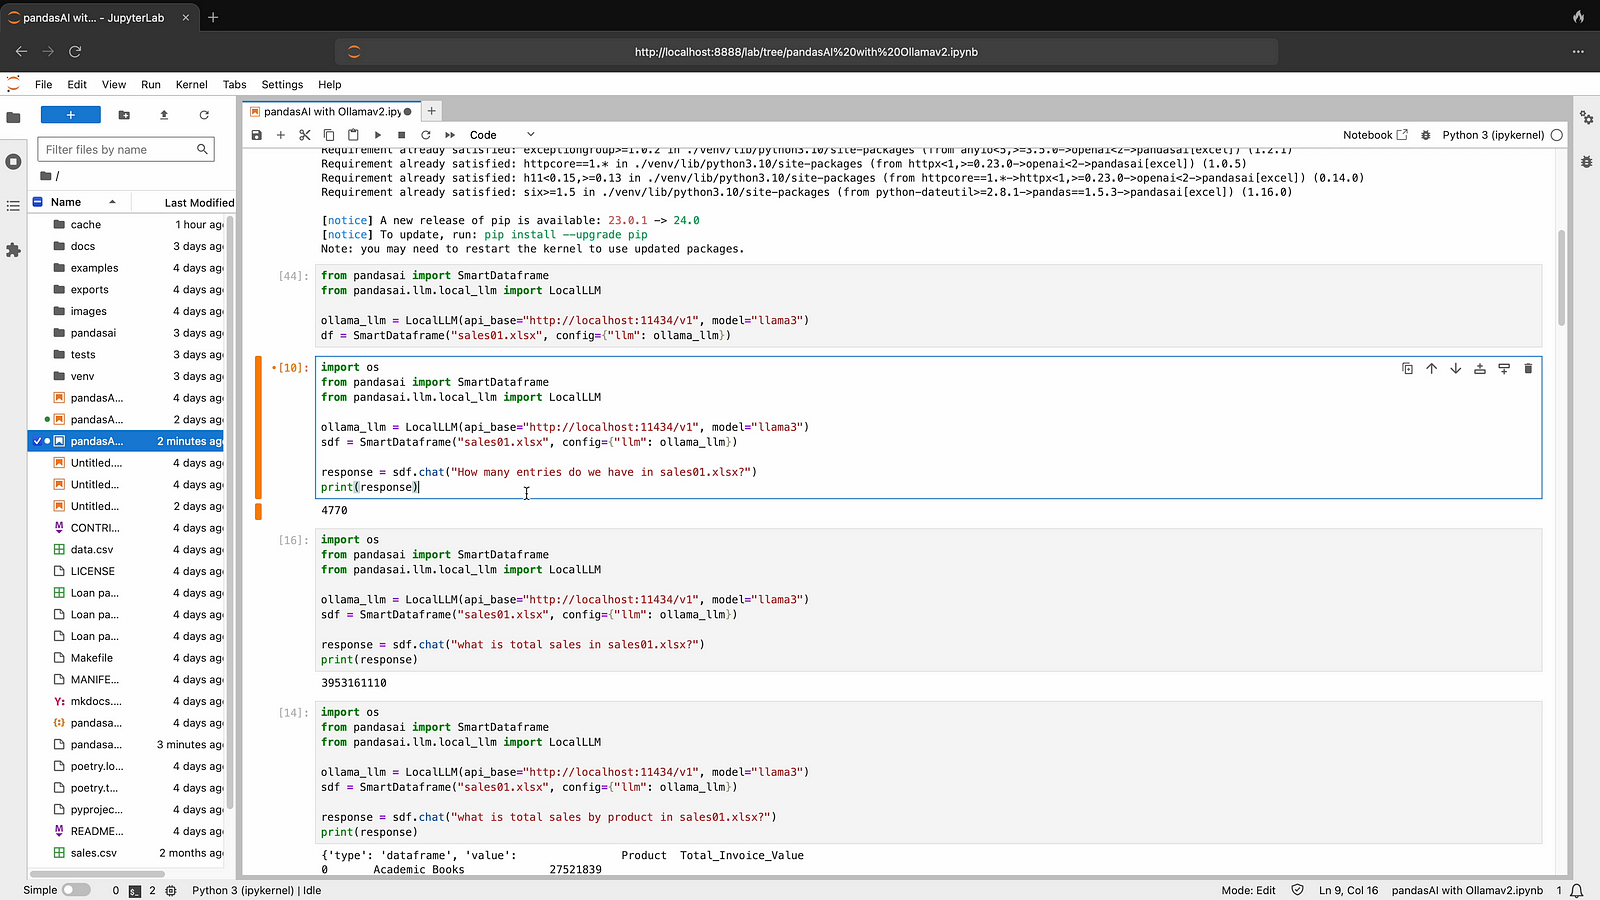
Step 04: Now ask your second question from Excel file, sample is given below.
import os
from pandasal import Smartbatatrame
from pandasai. Ulm. local_Ilm import LocalLLM
ollama_Um = LocalLLM(api_base="http: //localhost:11434/VI", model="llama3")
sdf = SmartDataframe ("sales01.xlsx", config={" lm": ollama_11m})
response = sdf.chat "what is total sales by region, sales representative in sales01.xls?")
print (response)
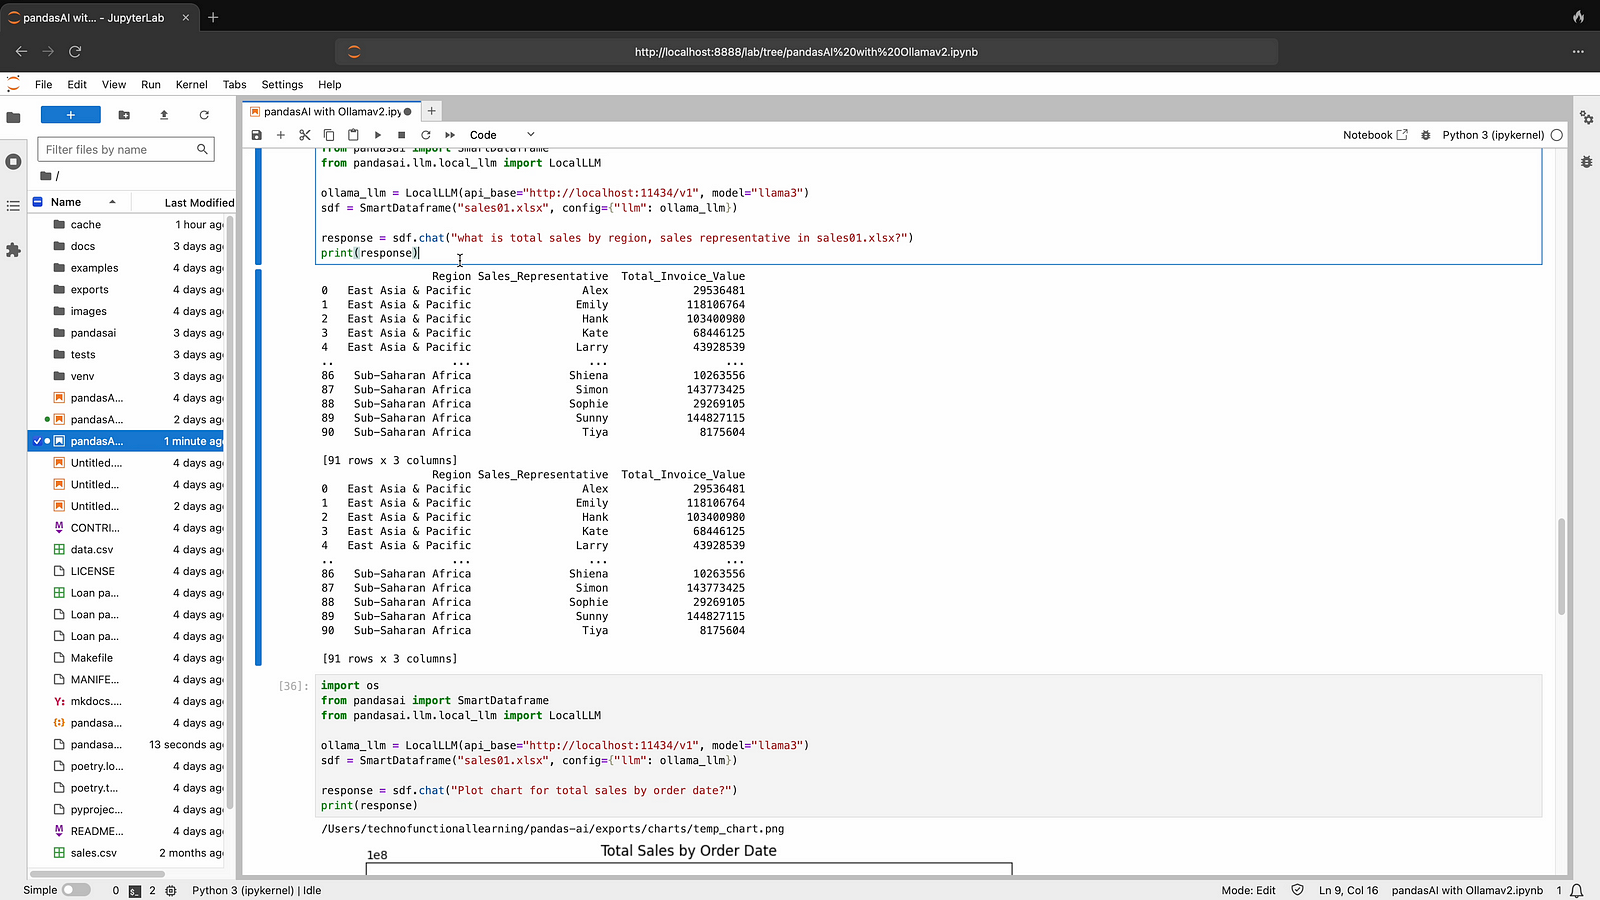
Step 05: Now ask to plot chart for your excel file, sample is given below.
import os
from pandasai import SmartDataframe from pandasai. 1lm. local_Ulm import LocalLLM

ollama_Ilm = LocalLLM(ap™_ base="http://localhost: 11434/VI", model="llama3")
sef = SmartDataframe ("sales01.xlsx", config= "Ilm": ollama_(lm})
response = sdf. chat("Plot chart for total sales by order date?")
print (response)

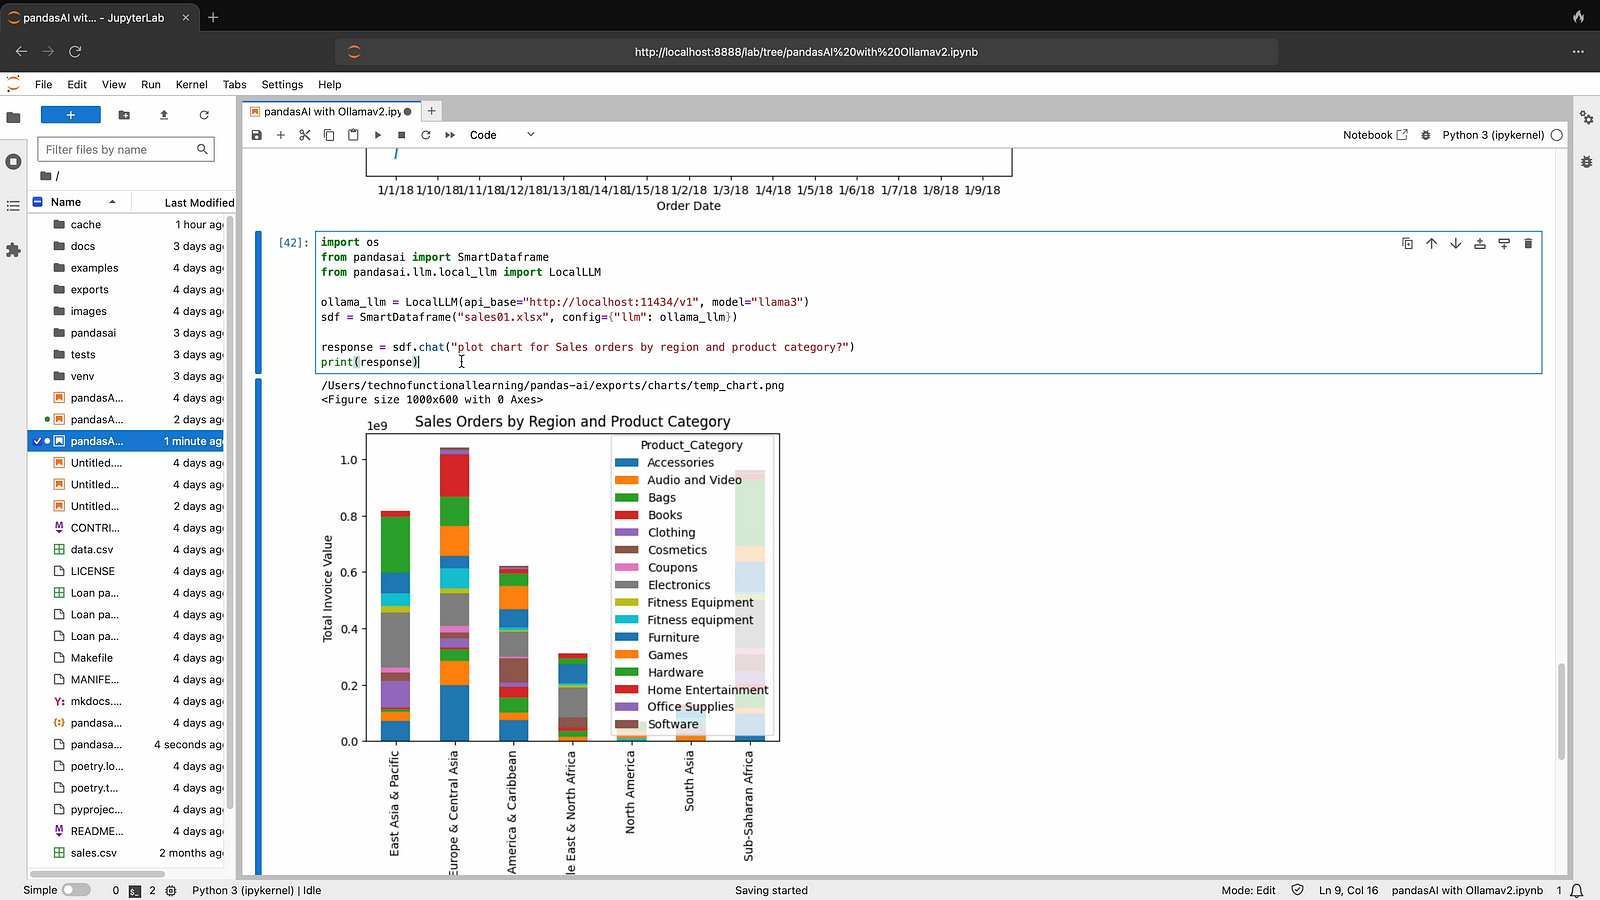
Step 06: Now ask to plot another chart for your excel, sample is given below
import os
from pandasai import SmartDataframe from pandasai.llm.local llm import LocalLLM

ollama_Ilm = LocalLLMapi_base="http://localhost: 11434/VI", model="llama3")
sdf = SmartDataframe ("sales01.xlsx", config={"llm": ollama_(lm})
response = sdf. chat ("plot chart for Sales orders by region and product category?")
print (response)
Here is youtube video for visual reference
