https://github.com/ClickHouse/ClickHouse
ClickHouse® is a real-time analytics DBMS
The real-time data warehouse for analytics, gaming, BI, Financial Services, Cyber Security, ML & Gen AI
https://github.com/apache/superset
Superset is fast, lightweight, intuitive, and loaded with options that make it easy for users of all skill sets to explore and visualize their data, from simple line charts to highly detailed geospatial charts.
Powerful yet easy to use
Superset makes it easy to explore your data, using either our simple no-code viz builder or state-of-the-art SQL IDE.
Integrates with modern databases
Superset can connect to any SQL-based databases including modern cloud-native databases and engines at petabyte scale.
Modern architecture
Superset is lightweight and highly scalable, leveraging the power of your existing data infrastructure without requiring yet another ingestion layer.
Rich visualizations and dashboards
Superset ships with 40+ pre-installed visualization types. Our plug-in architecture makes it easy to build custom visualizations.
Lets get started:
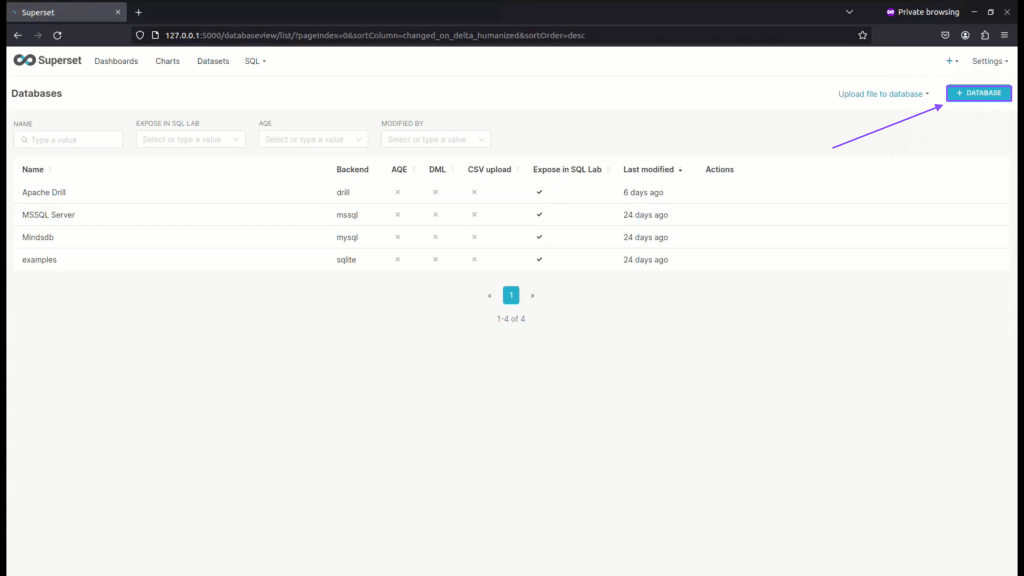
Step 01: Click on add Database
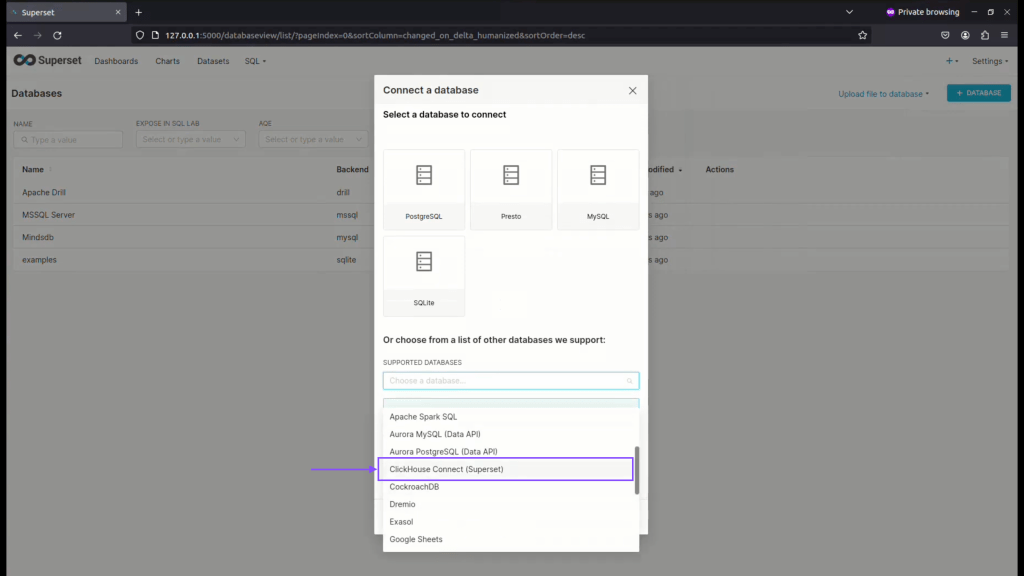
Step 02: choose ClickhouseDB from the list, kindly make sure you have added database dependency for Clickhousedb.
Step 03: Enter SQLAlchemy URL for connecting with ClickhouseDB, followed by test connection and then connect.
clickhousedb://localhost:8123

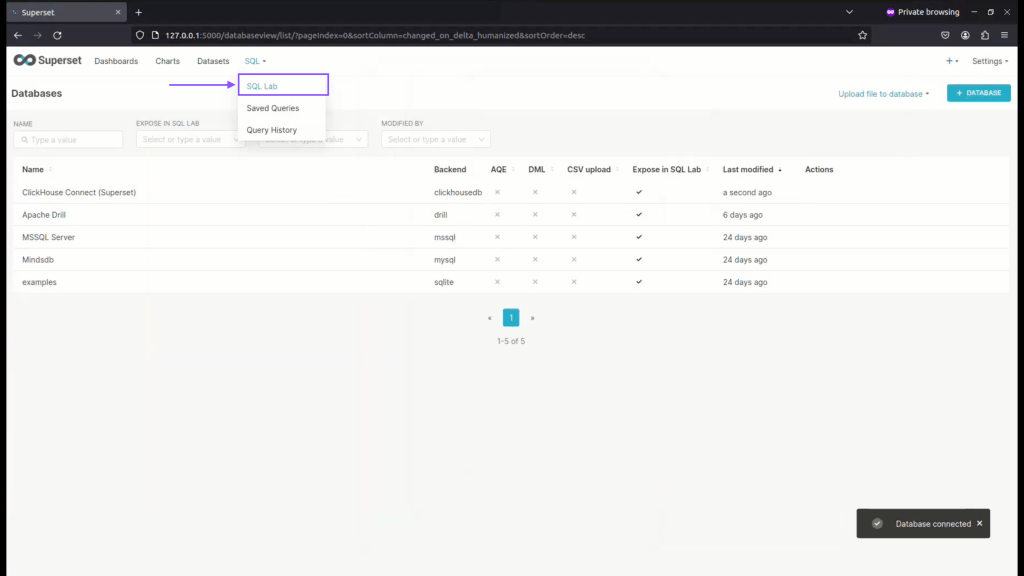
Step 04: Now click on SQL Lab to view Database.
Step 05: Choose Database as ClickhouseDB
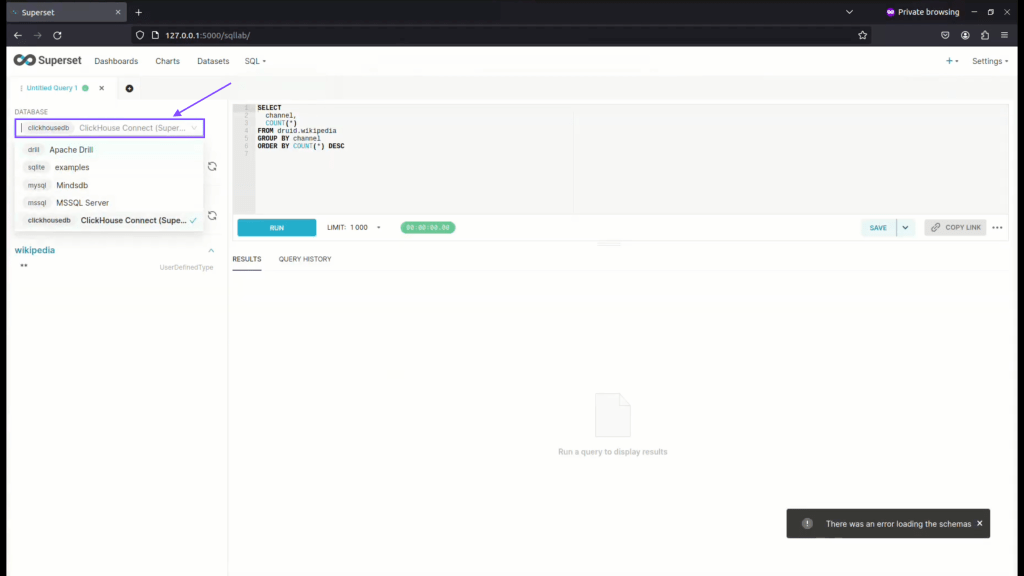
Step 06: Choose schema as default
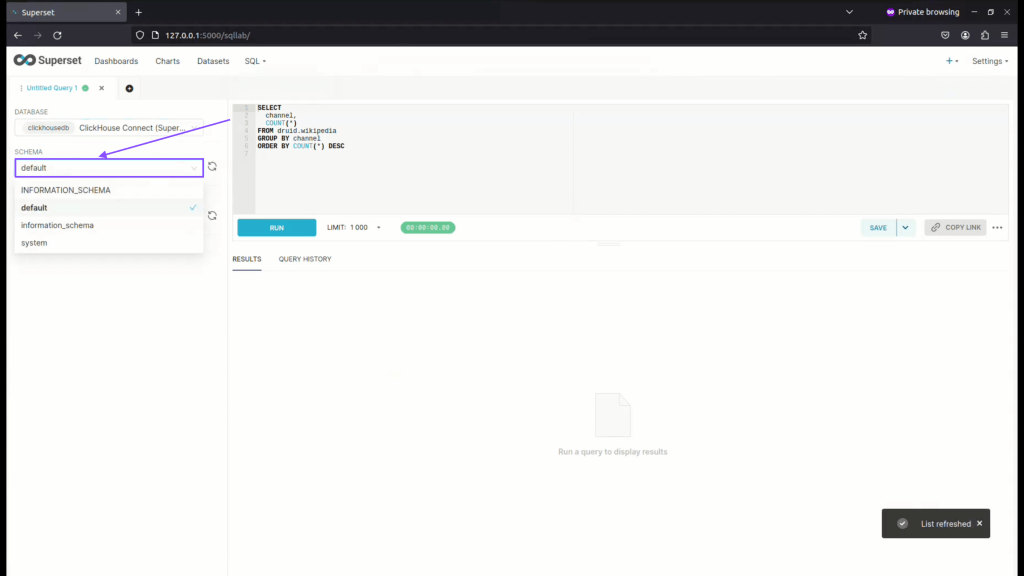
Step 07: Now choose table schema from schema

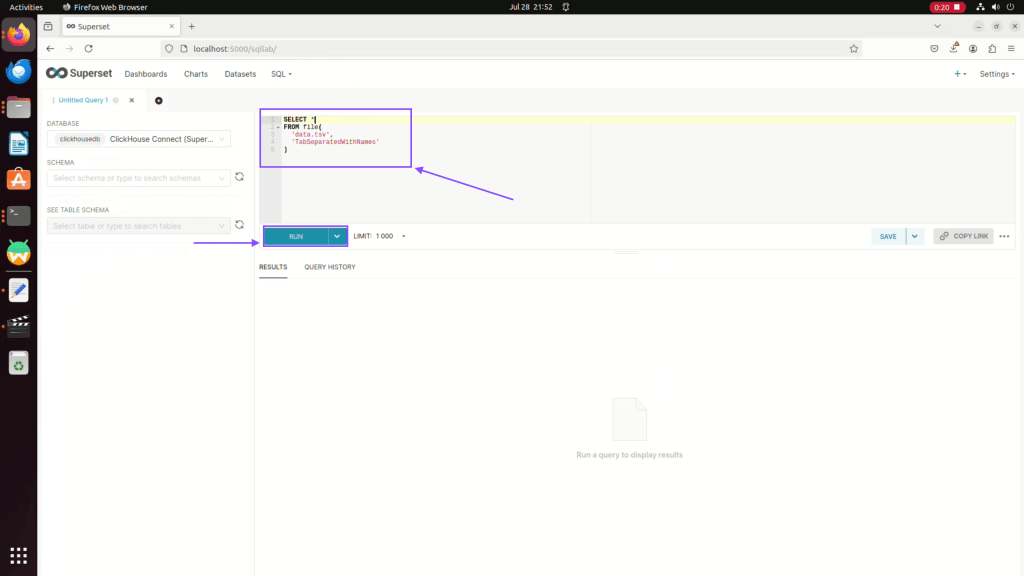
Step 08: Here you can see your data, now you can also write custom SQL Query or directly query files as shown in next step.

Here is Quick Youtube video for Visual reference of How to Connect Apache Superset with ClickhouseDB
Step 09: Now write SQL Query for viewing TSV File Data
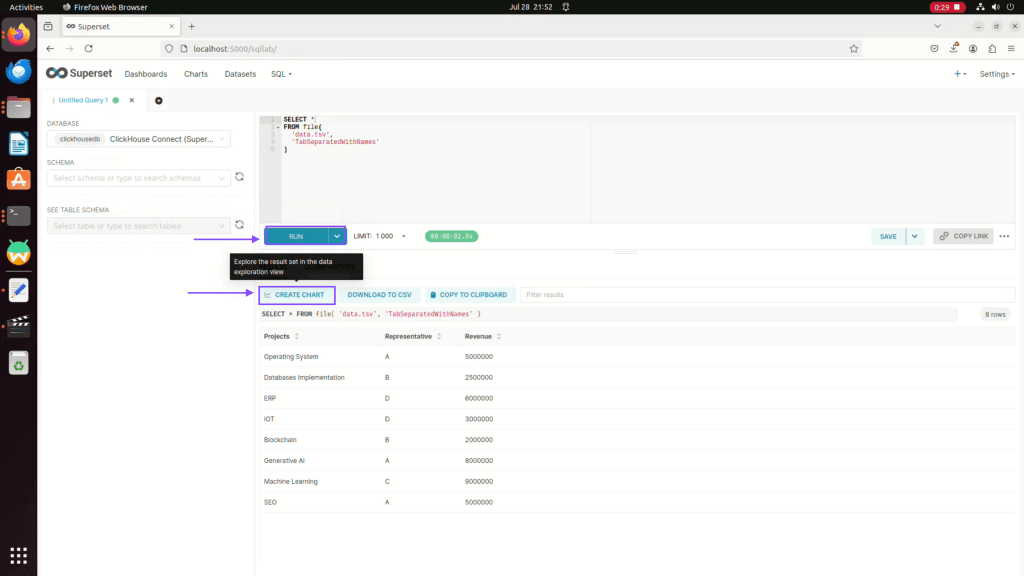
Step 10: Now after running query and getting data, you can click on create chart to visualize the data.
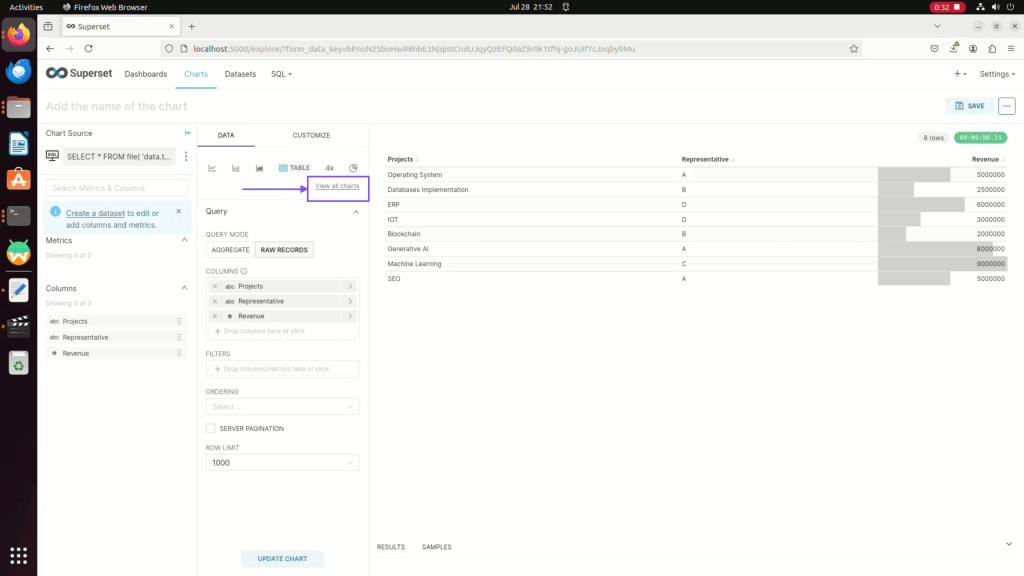
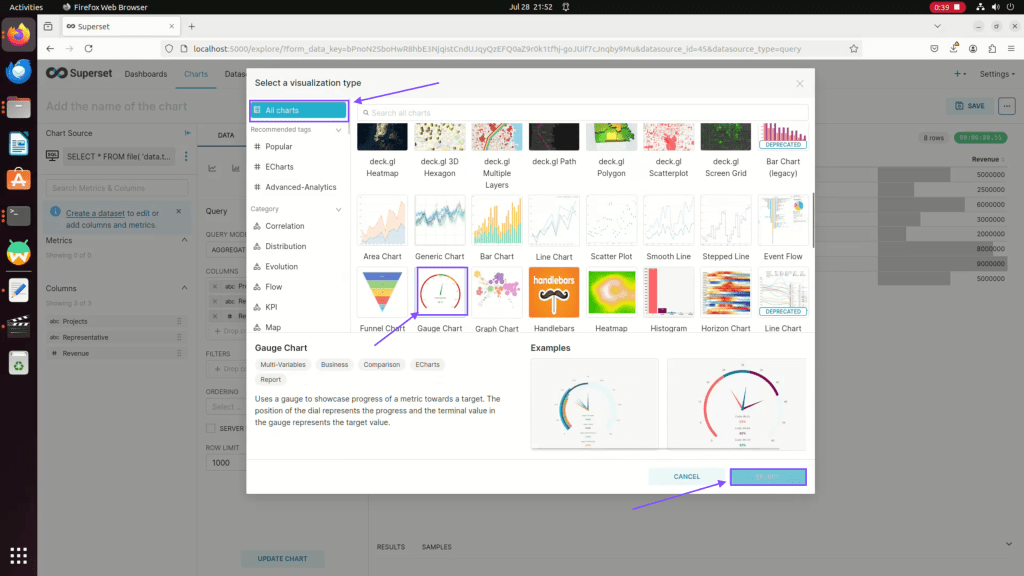
Step 11: Now click on view all charts
Step 12: Click on All charts, then choose gauge chart and then click on ok.
Step 13: Now drag and drop value metrics and choose aggregate type
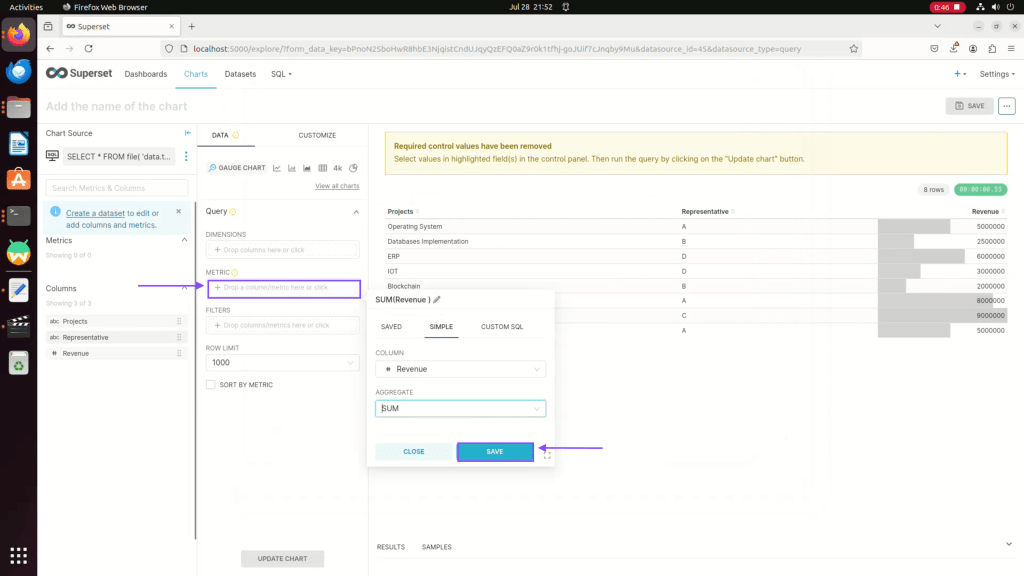
Step 14: Now You should have Dimensions and Metric at their place before you can customize it further.

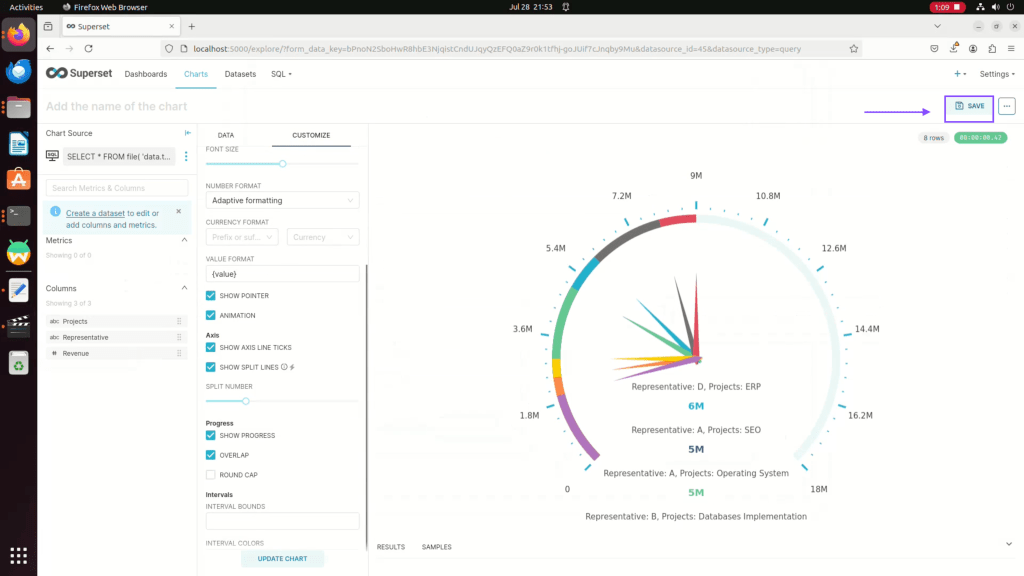
Step 15: Now click on customize

Step 16: You can customize the value here and update the chart

Step 17: Click on save chart to add it to dashboard
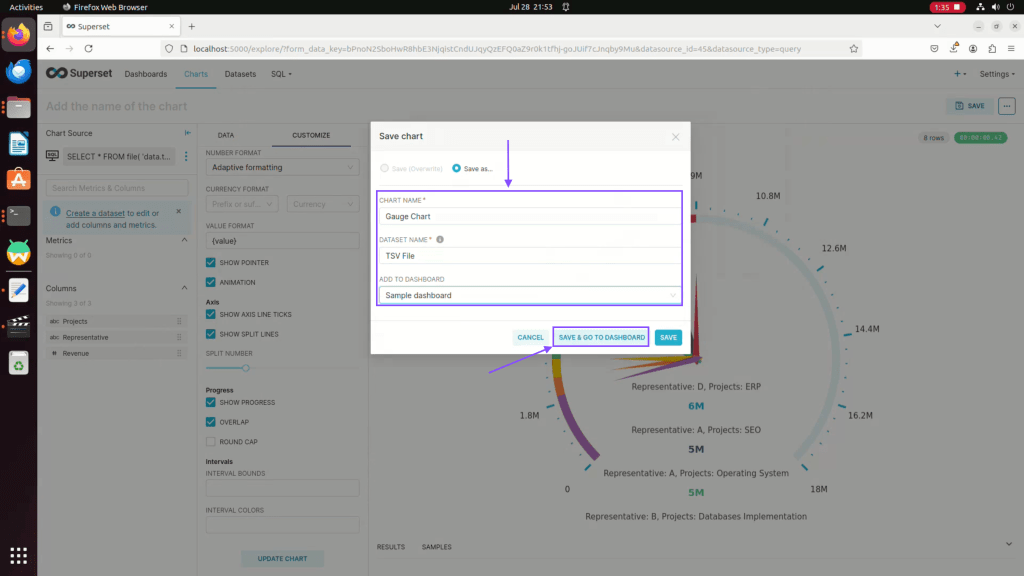
Step 18: Now enter the chart name, dataset name, and choose sample dashboard then click on save and go to dashboard.
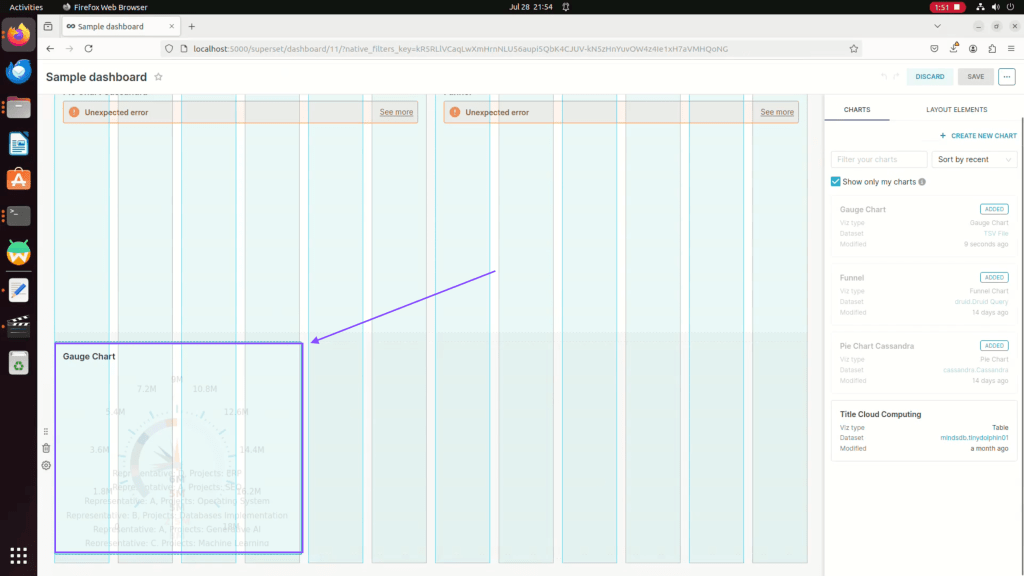
Step 19: Now you can drag and drop or resize the chart and then click on save .
Step 20: You can have charts for Various data sources in single dashboard.

Here is youtube video for quick visual reference.

You must be logged in to post a comment.